What is ERT?
Electrical Resistivity Tomography (ERT) is a geophysical technique that uses electrical currents to image the subsurface. Don’t let the name intimidate you, let’s break it down:
- Electrical: an electrical field is passed through the ground (and measured along the way)
- Resistivity: we are interested in knowing how different materials “resist” that current going through them
- Tomography: just a fancy word to main an image (-graphy) of a section (tomo-) of something
The basic principle is that different materials conduct electricity through them more easily (conductive) or with more difficulty (resistive). Metals have extremely low resistivities, which means they conduct electricity well without much loss of power. This is why we use them in electronics and wiring.

ERT is a non-invasive geophysical technique. That means that the ground remains essentially as it is. The only disturbance to the ground (aside from walking along it) is a series of metal electrodes (think tent stakes that are less than 1/2″ (5-15 mm) thick that are placed into the ground every few yards or meters along the length of the measurement. An example of what one of these electrodes might look like is shown to the right (note this is a generated image, not a real electrode). These are only in the ground for the time it takes to do a measurement (usually, less than a couple of hours). The amount of electricity injected into the ground varies, but in many common arrays, it is less than 5% of the power provided in a standard outlet.
How was ERT developed?
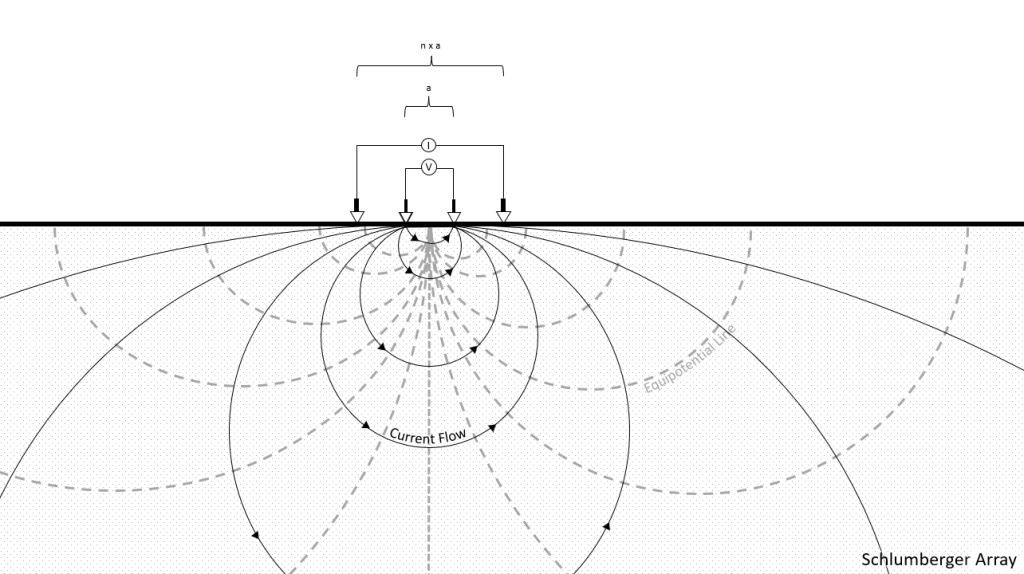
ERT has its roots in the early 20th century, when two French brothers, Conrad and Marcel Schlumberger, invented a method of prospecting for metal ore deposits by using electrical measurements. Conrad developed much of the technique by experimenting in a bathtub filled with various materials in his basement. They experimented with different electrode configurations and discovered that they could detect the presence of ore bodies by measuring the electrical potential difference between two points on the surface. They called this technique an “electrical survey” or a “Schlumberger array” 1. It is still one of the most widely used ERT arrays today.
In 1927, they performed the first electrical resistivity well log, which is a measurement of the resistivity along a borehole. They lowered an electrode into a well and measured the voltage between it and another electrode on the surface. They repeated this process at different depths and obtained a profile of the resistivity along the well. This technique allowed them to identify different rock layers and fluid zones in the well 1.
In the following decades, ERT was improved by introducing new electrode arrays, new instruments, and new data processing methods. ERT also expanded its applications from mineral exploration to hydrogeology, engineering, archaeology, environmental monitoring, and more. Little of the basic idea has changed, only computers and electrical technology have allowed for more precise and efficient measurements and numerical modeling of the resulting data.
What can ERT be used for?
ERT can be used in many different fields and for various applications. A few examples include:
- Locating groundwater aquifers and estimating their depth and thickness.
- Mapping geological structures such as geologic interfaces, faults, fractures, folds, and caves.
- Detecting mineral deposits such as coal, iron, copper, gold, and uranium.
- Investigating engineering sites such as dams, bridges, tunnels, landfills, pipelines, and foundations.
- Exploring archaeological sites such as tombs, temples, walls, and artifacts.
- Monitoring environmental changes such as landslides, subsidence, contamination, and remediation.
How does ERT work?
How is ERT data collected?
Among the most important parts of the ERT process is the “injection” of the current from the measurement instrument into the ground. This is usually done by connecting a specialized ERT cable or series of cables to the main instrument. These ERT cables have “takeouts”, which are basically ports or plugs that allow “electrodes” to create a continuous electrical circuit between the instrument and the ground. Electrodes are often as simple as metal stakes that can be driven into the ground, and which are then connected to the takeouts main cable. Sometimes water, saline solution, or a similar “brine” is poured where the electrodes meet the Earth to increase the electrical continuity between the electrodes and the ground. Often, dozens of electrodes are set up at once, and a computer in the instrument switches on and off the takeouts in various combinations of ways so that different sets of electrodes are being used to take anywhere from a few to tens of thousands of measurements at one go. By changing the positions and distances of the electrodes on the surface or in boreholes, ERT can measure the apparent resistivity at different locations and depths. A set of cables 200 yards/meters long with 40-50 electrodes attached, for example, can result in hundreds of measurements to depths of about 30 yards/meters for most of that 200-yard/meter run.
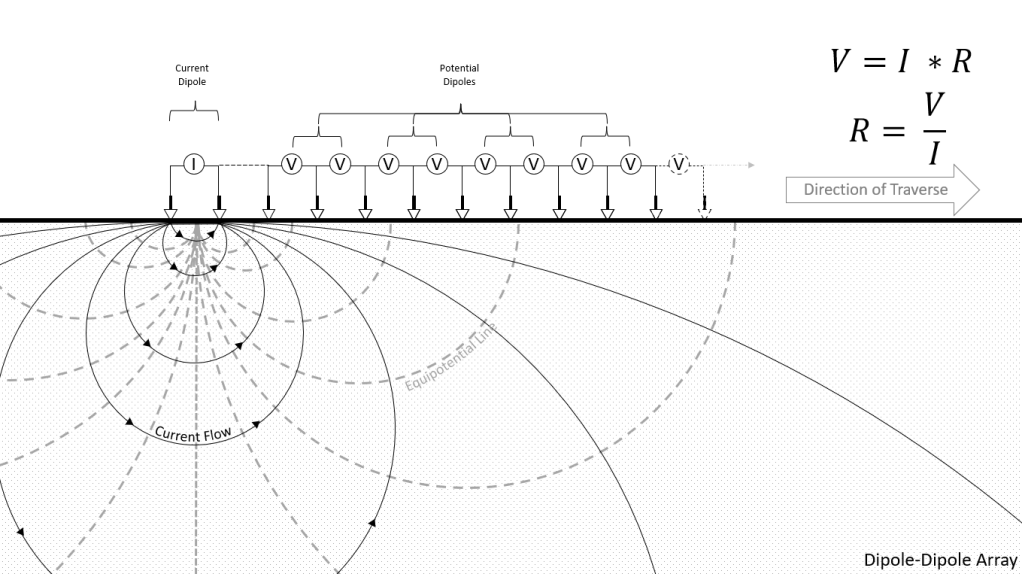
To take these individual measurements, electrical current is injected into the ground using a pairs of electrodes called current electrodes (in some contexts, a pair is called a dipole). The current flows through the subsurface along paths determined by the resistivity distribution. Another pair (or multiple pairs) of electrodes called potential electrodes measures the voltage difference between them that results from this injected current. A simple calculation of the measured voltage divided by the injected current gives a raw resistance measure. This raw resistance measure is corrected later for the distance between the electrodes to get an “apparent resistivity,” which is a bulk measure of the resistivity of the material over the entire area the measurement was taken.
How is ERT data processed and displayed?
The resistance or apparent resistivity data are processed by a computer program that carries out a mathematical procedure called “inversion.” Inversion takes the measured resistivity values from the various depths and locations and calculates a distribution of the resistivity of material in the ground. This is required because a measurement at (for example) 25 yards/meters depth actually flowed through and therefore includes all material down to that depth, as well as everything between the electrodes involved in the measurement. Inversion helps convert the data from this bulk measurement to a more realistic distribution of the subfurface material properties.
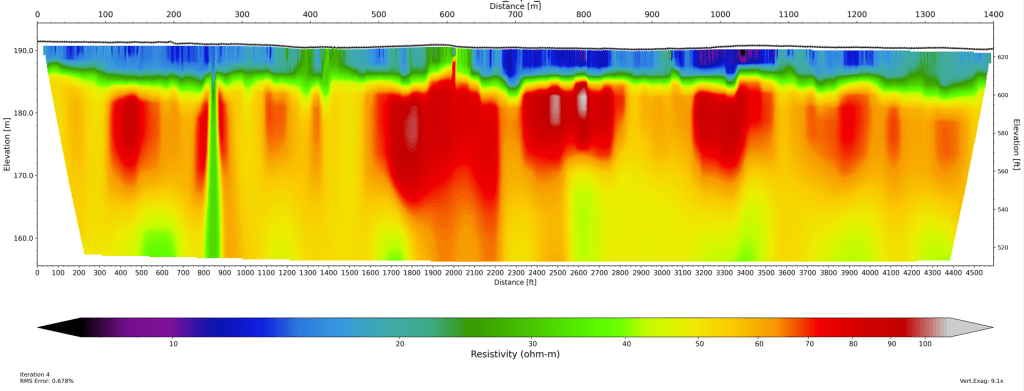
The final result is called a “model” of the resistivity of the subsurface. The model is usually displayed as a 2D or 3D image that shows the variations in resistivity in different colors or shades. The image can then be interpreted by geologists or engineers to infer information about the subsurface features.
For more ifnromation on ERT, check out the following resources

You must be logged in to post a comment.