What a year.
As an historic pandemic ravaged the globe, Earth science as a whole has had to deal with major changes and delays. In a series of studies documenting the impact Sars-cov-2 (Aka, CoViD-19) has had on the geoscience enterprise, the American Geosciences Institute (AGI) has demonstrated serious and probably long-lasting effects of the pandemic on the geosciences. More than 90% of respondents to AGI’s survey noted some kind of change to research, with more than 90% of faculty saying their research had been delayed in some manner. Nearly half of undergraduate researchers surveyed reported research termination, the highest of any of the three groups. The impact this has had on the future of the geosciences remains to be seen.
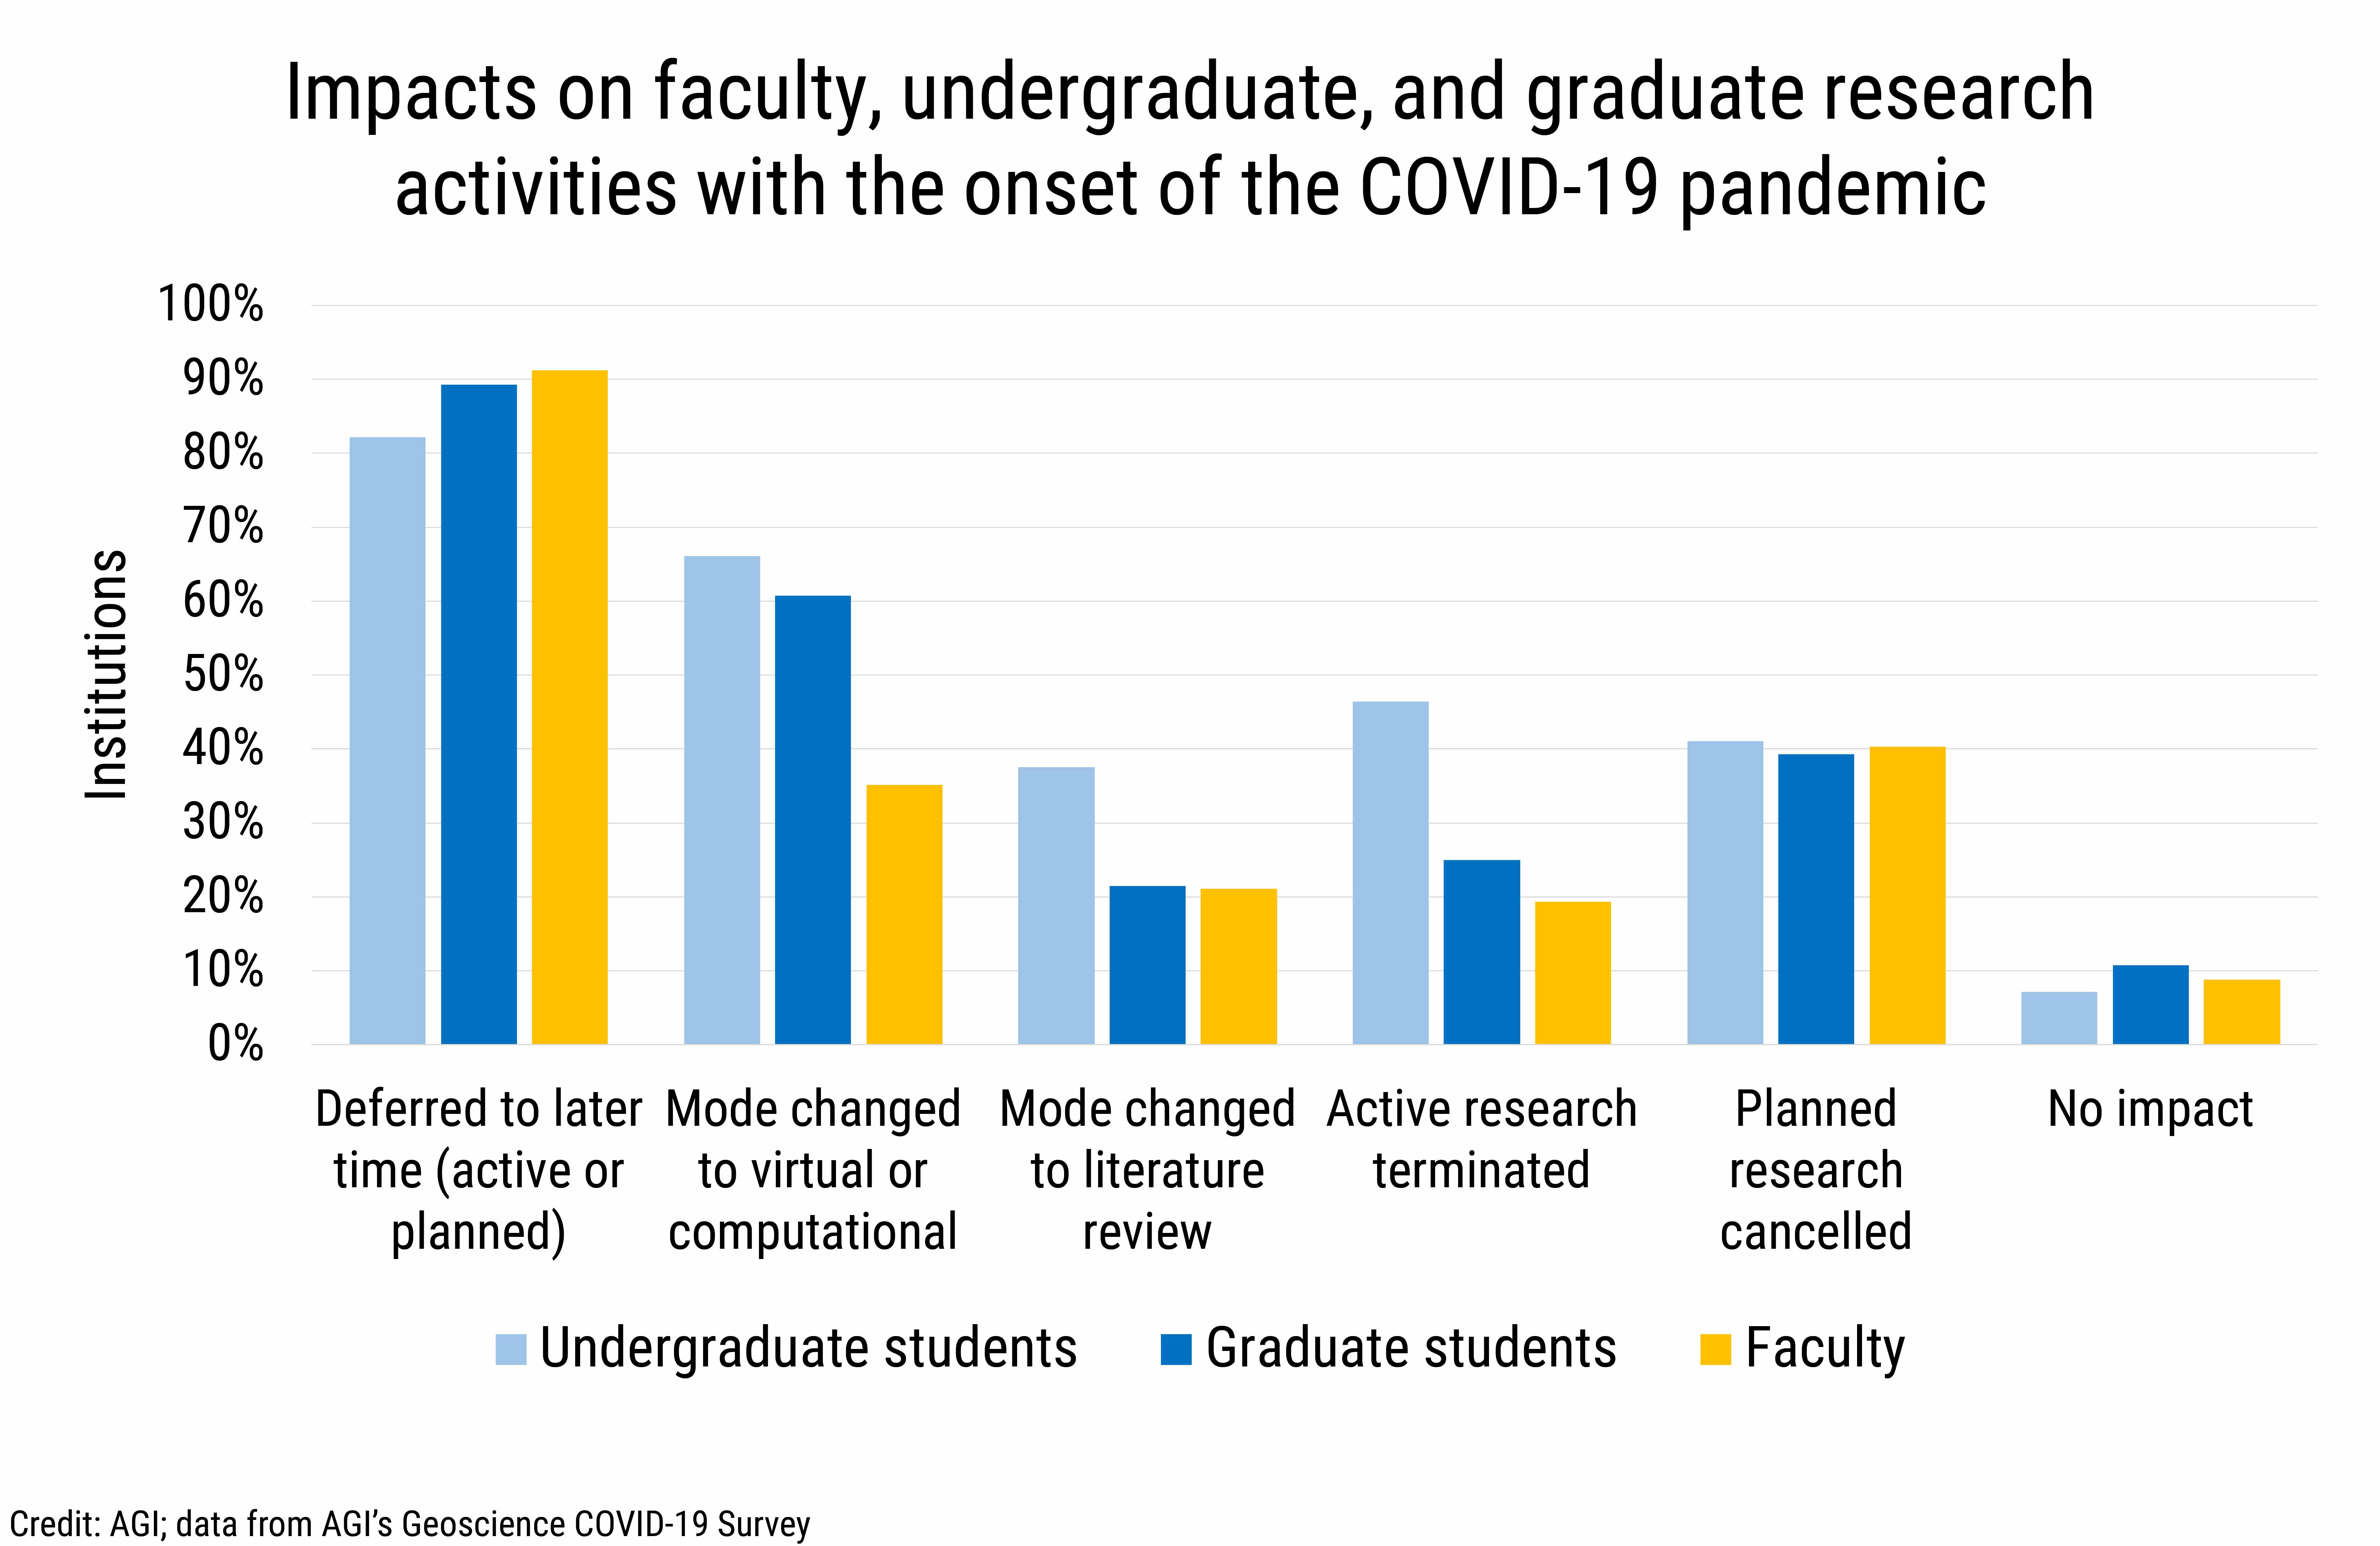
In short, the pandemic has had a large impact on geoscience research, and it will continue to have effects even after it has abated, as an entire cohort of students and other researchers will have a barebones research portfolio relative to student cohorts of other years.
At the Illinois State Geological Survey (ISGS), we have been continuing research as best as we can, with some inevitable delays and suspensions. Those who have been able to work from home have moved their workspaces to residences all around the state, while others have been taking what precautions they can as they continue to do their work in the field or elsewhere.
Conferences were cancelled, postponed, or held remotely. These conferences have tended to be outlets for a fair portion of the applied work we do in the geophysics and hydrogeology section at ISGS, so the extra level of analysis and interpretation that goes into those posters, presentations, or papers just did not happen as much.
The past year has also been a year of great changes here. Just in the geophysics and hydrogeology section, there have been two babies born in the past year and one retirement of a 40+ year veteran of Earth sciences in Illinois.
In spite of all the churn and change and challenges, we were still able to do some great work in geophysics and hydrogeology. (Most of these will be work I was involved in, but may draw from others’ as well.)
Resistivity in the River
We started the year by capping off a dataset we have been collecting in the Sangamon River for the past two years.
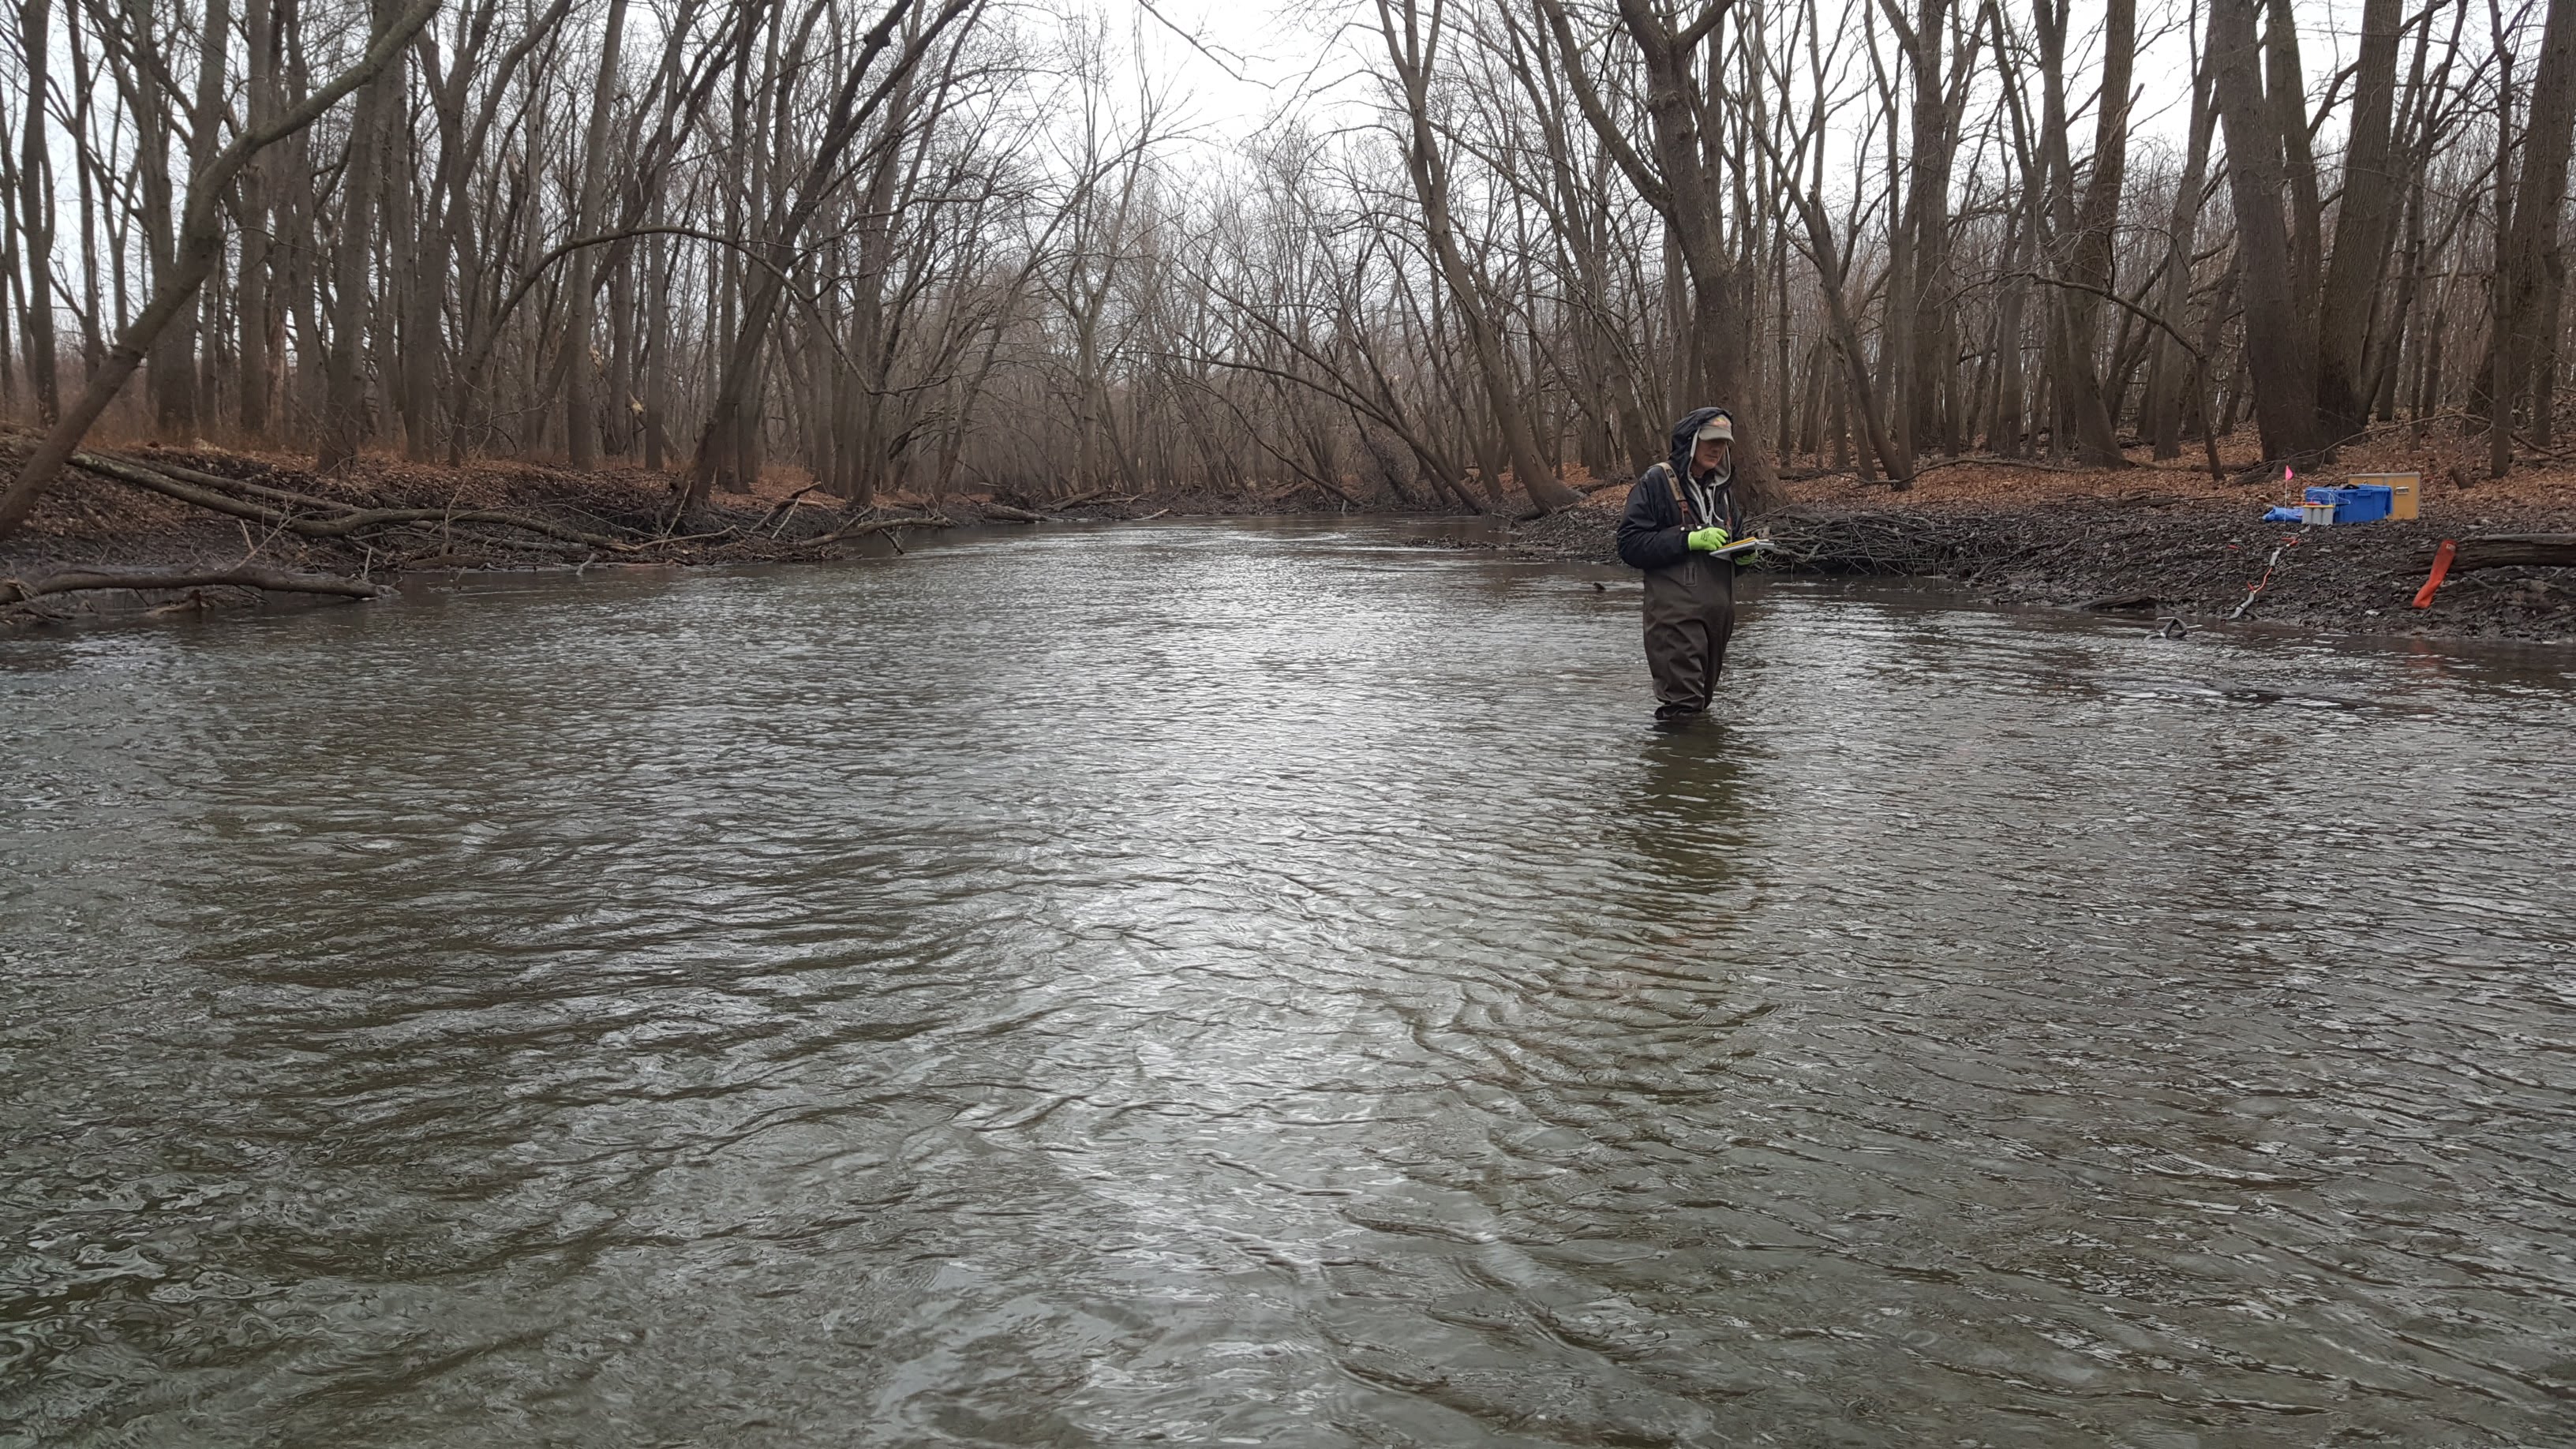
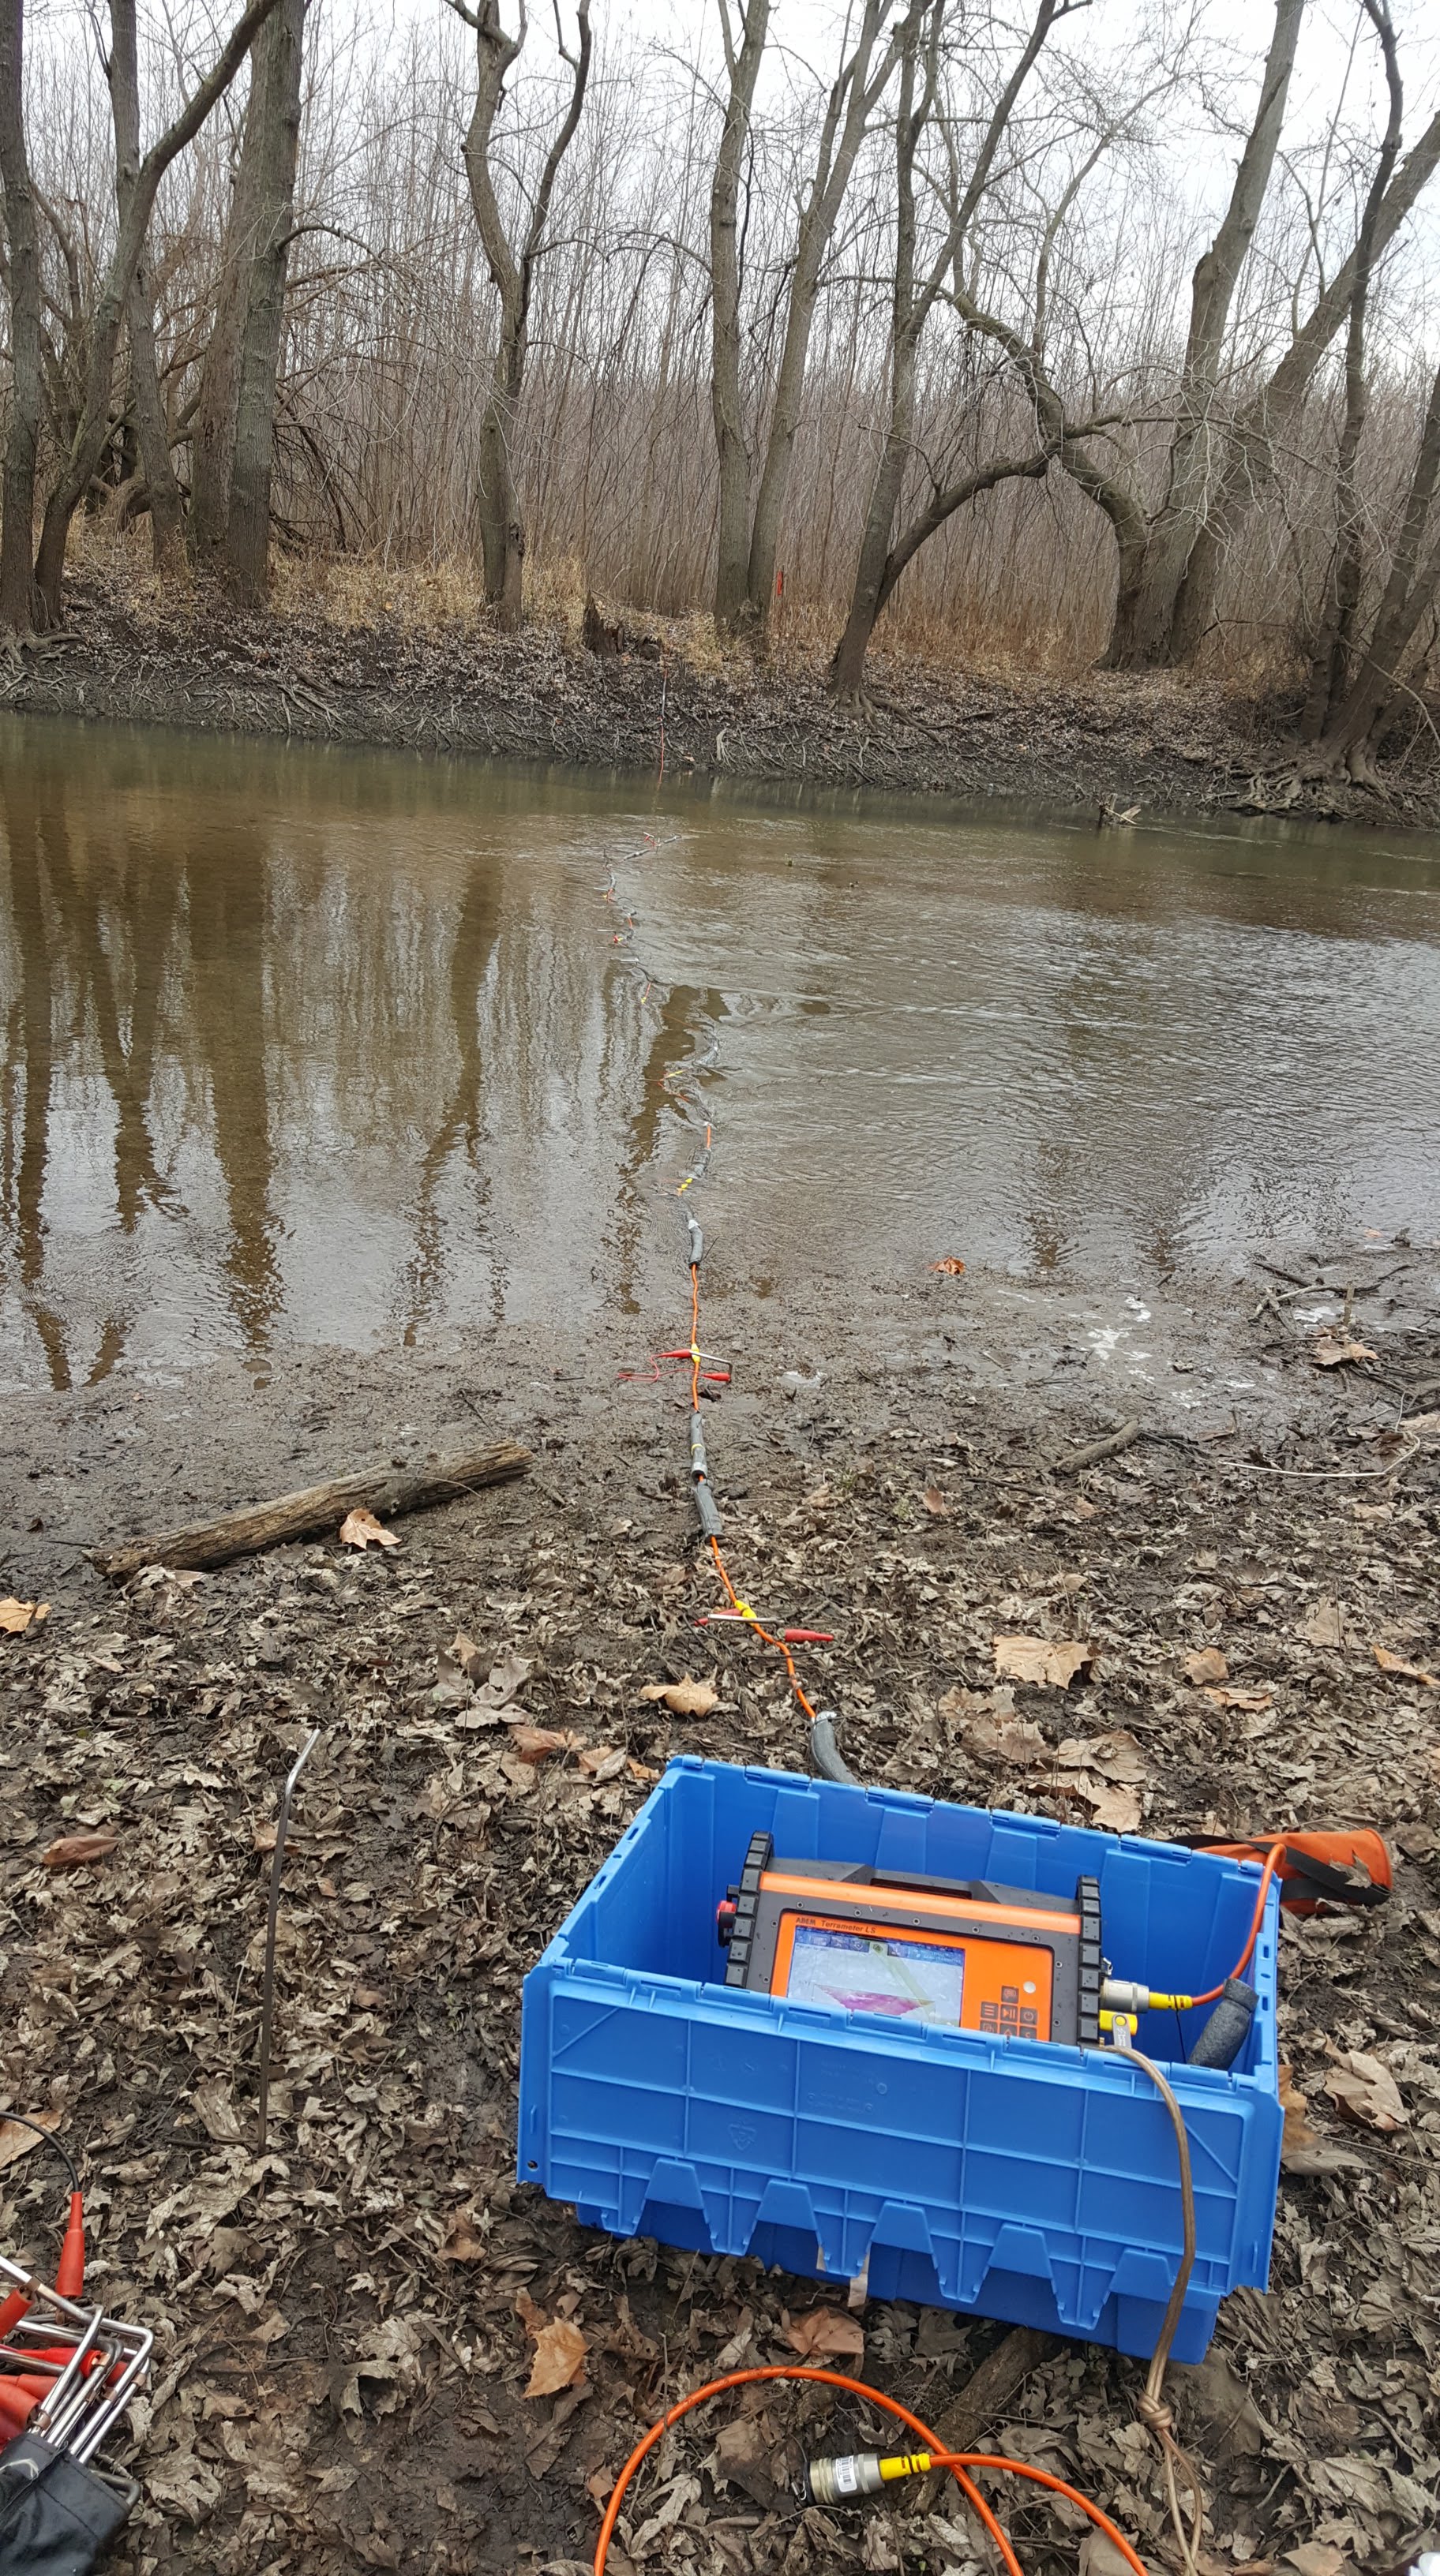
The Geophysics and Hydrogeology Section and the Quaternary Section at ISGS have both been collecting lots of different types of data at this stretch of the Sangamon to try to quantify and/or characterize the relationship between groundwater flowing into the river from below and beside it and the surface water in the river itself. The foundation of this effort has been a Distributed Temperature Sensing (DTS) setup installed by one set of scientists in the geophysics section. The DTS uses fiber optic cables to measure very high spatial resolution temperature along the cable, which was laid along the bottom of a 1 kilometer stretch of the river. Temperature varies over space and time, depending on what is going on in the river, and the DTS system was put in place to help measure that and make geologic interpretations.
For example, the Earth is an excellent insulator against seasonal temperature change. While the air gets very cold in the winter and very hot in the summer, you only have to go a few feet underground to get to groundwater that stays at a steady temperature the whole year ’round. This makes it (relatively) easy to find where groundwater is coming into the river: in the winter, you are looking for a “hot” spot; in the summer, you are looking for a cooler area.
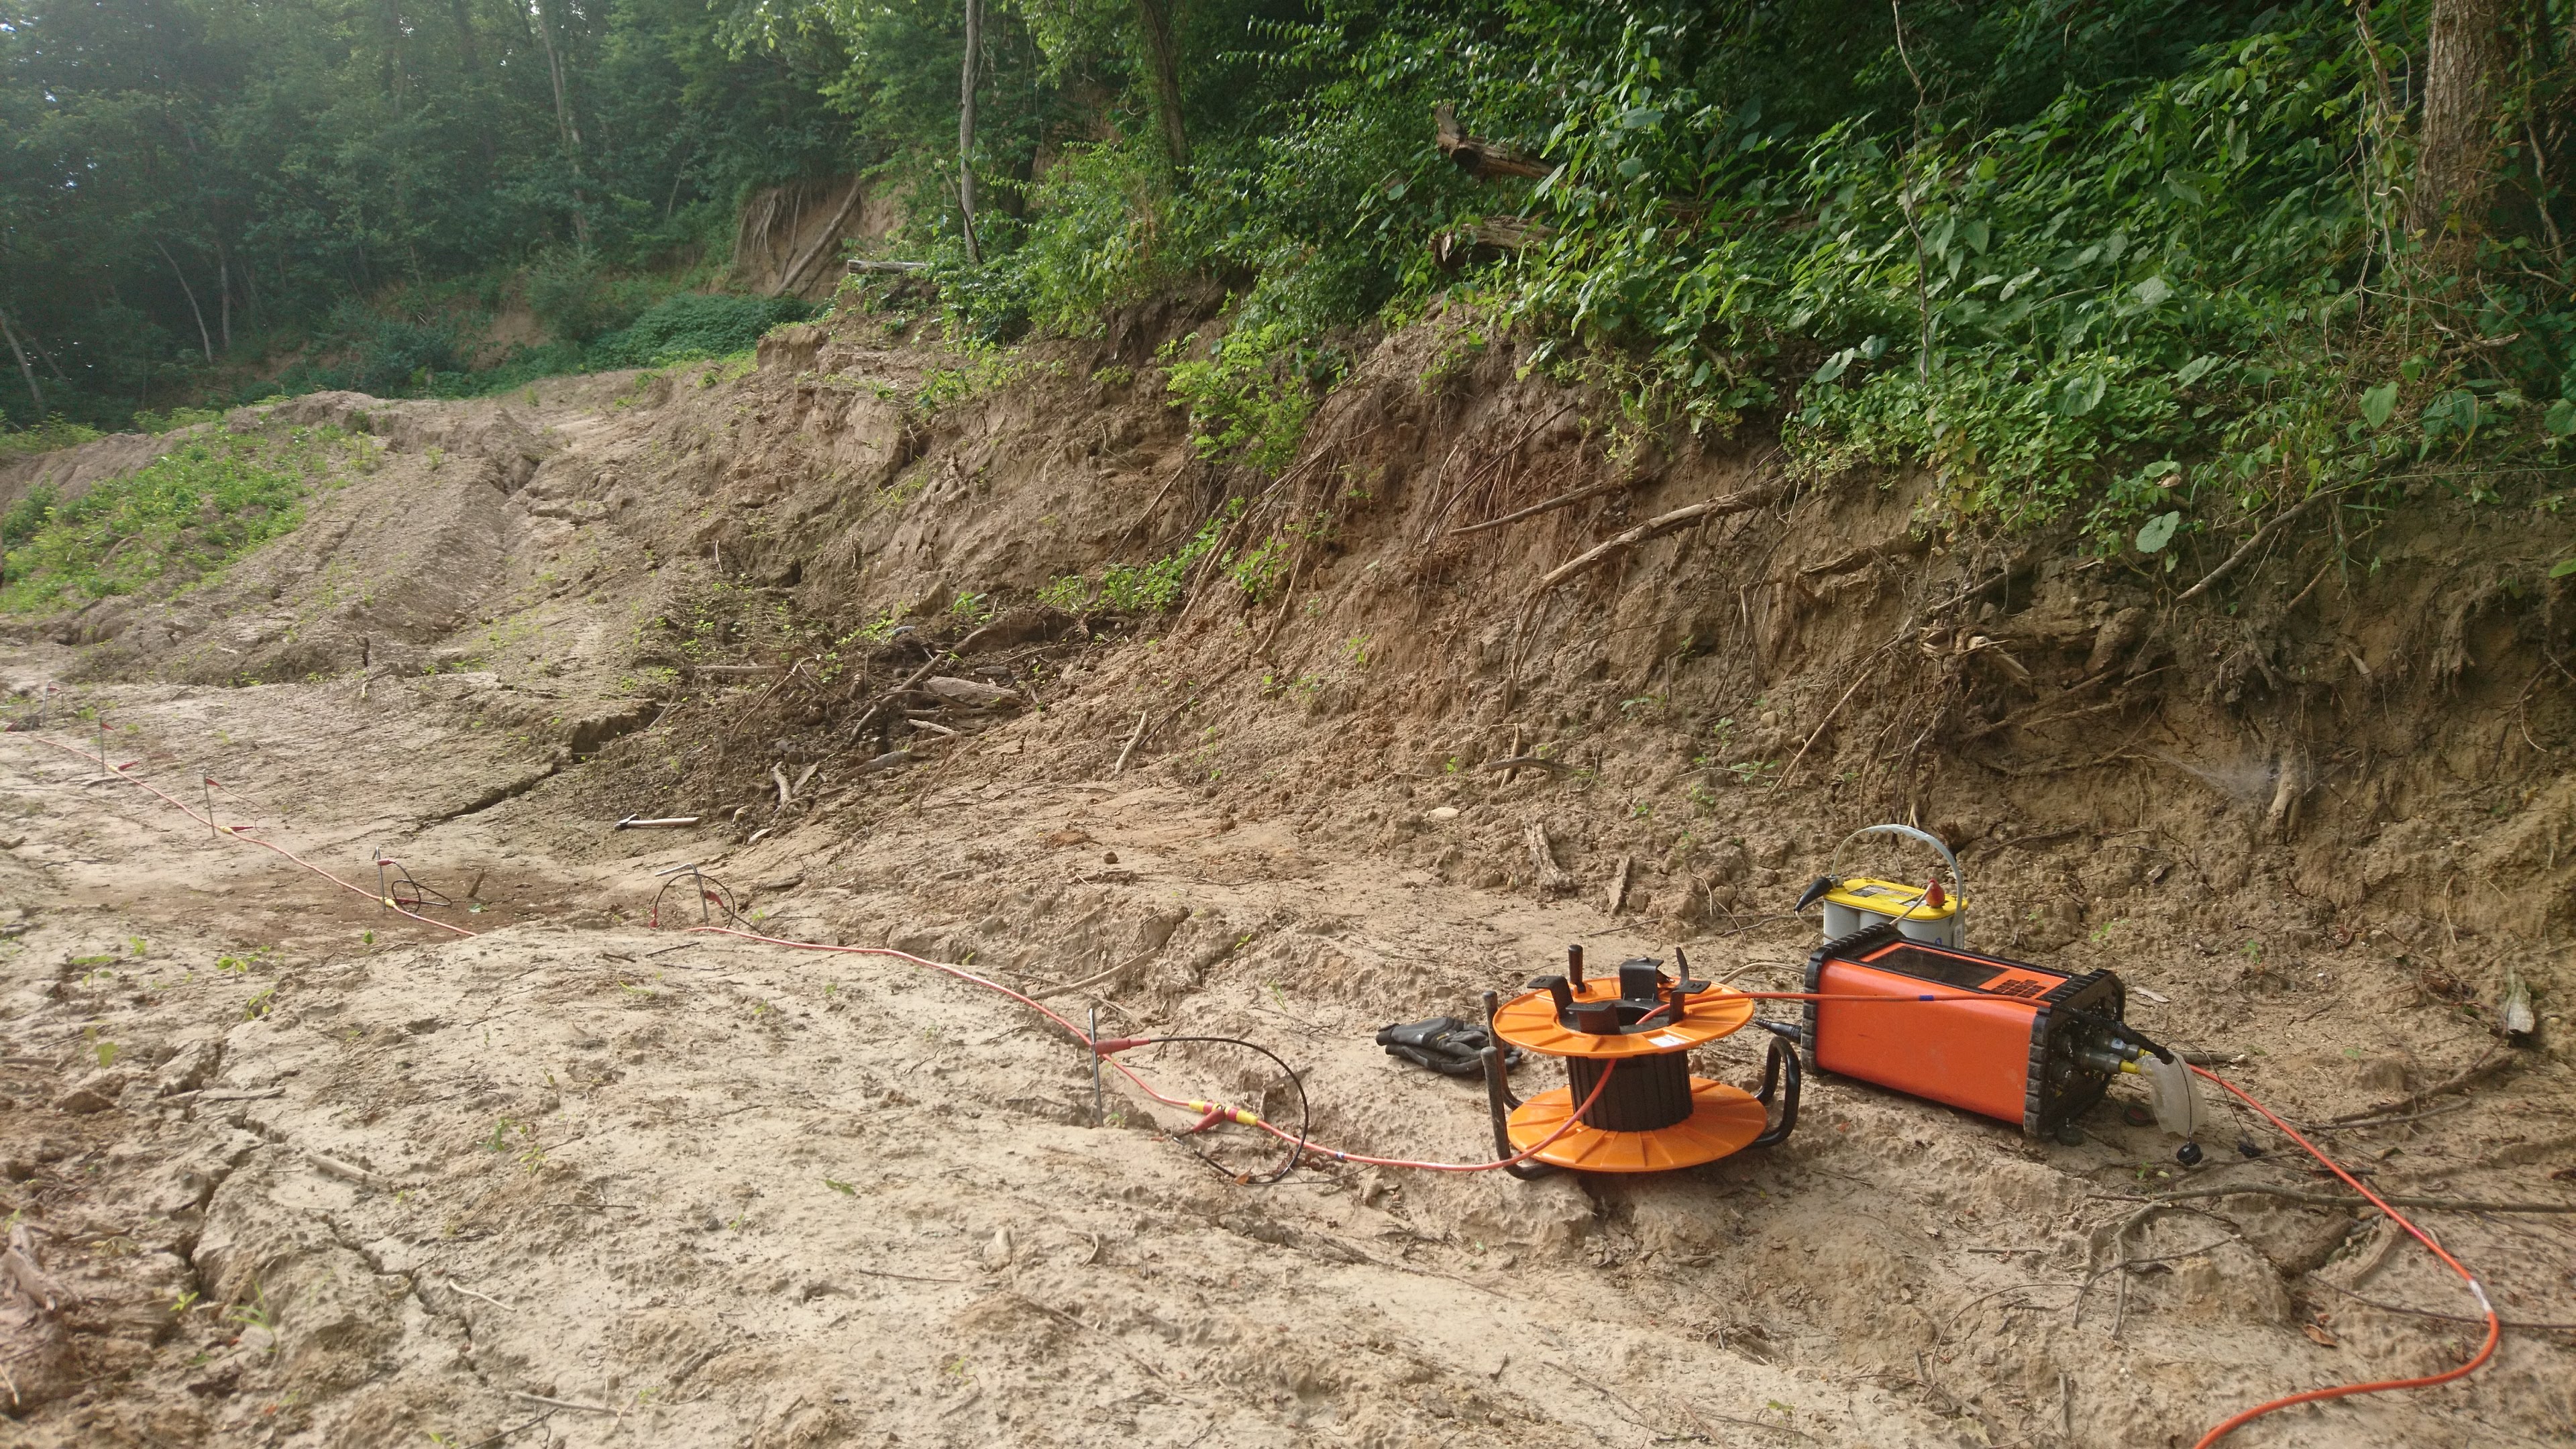
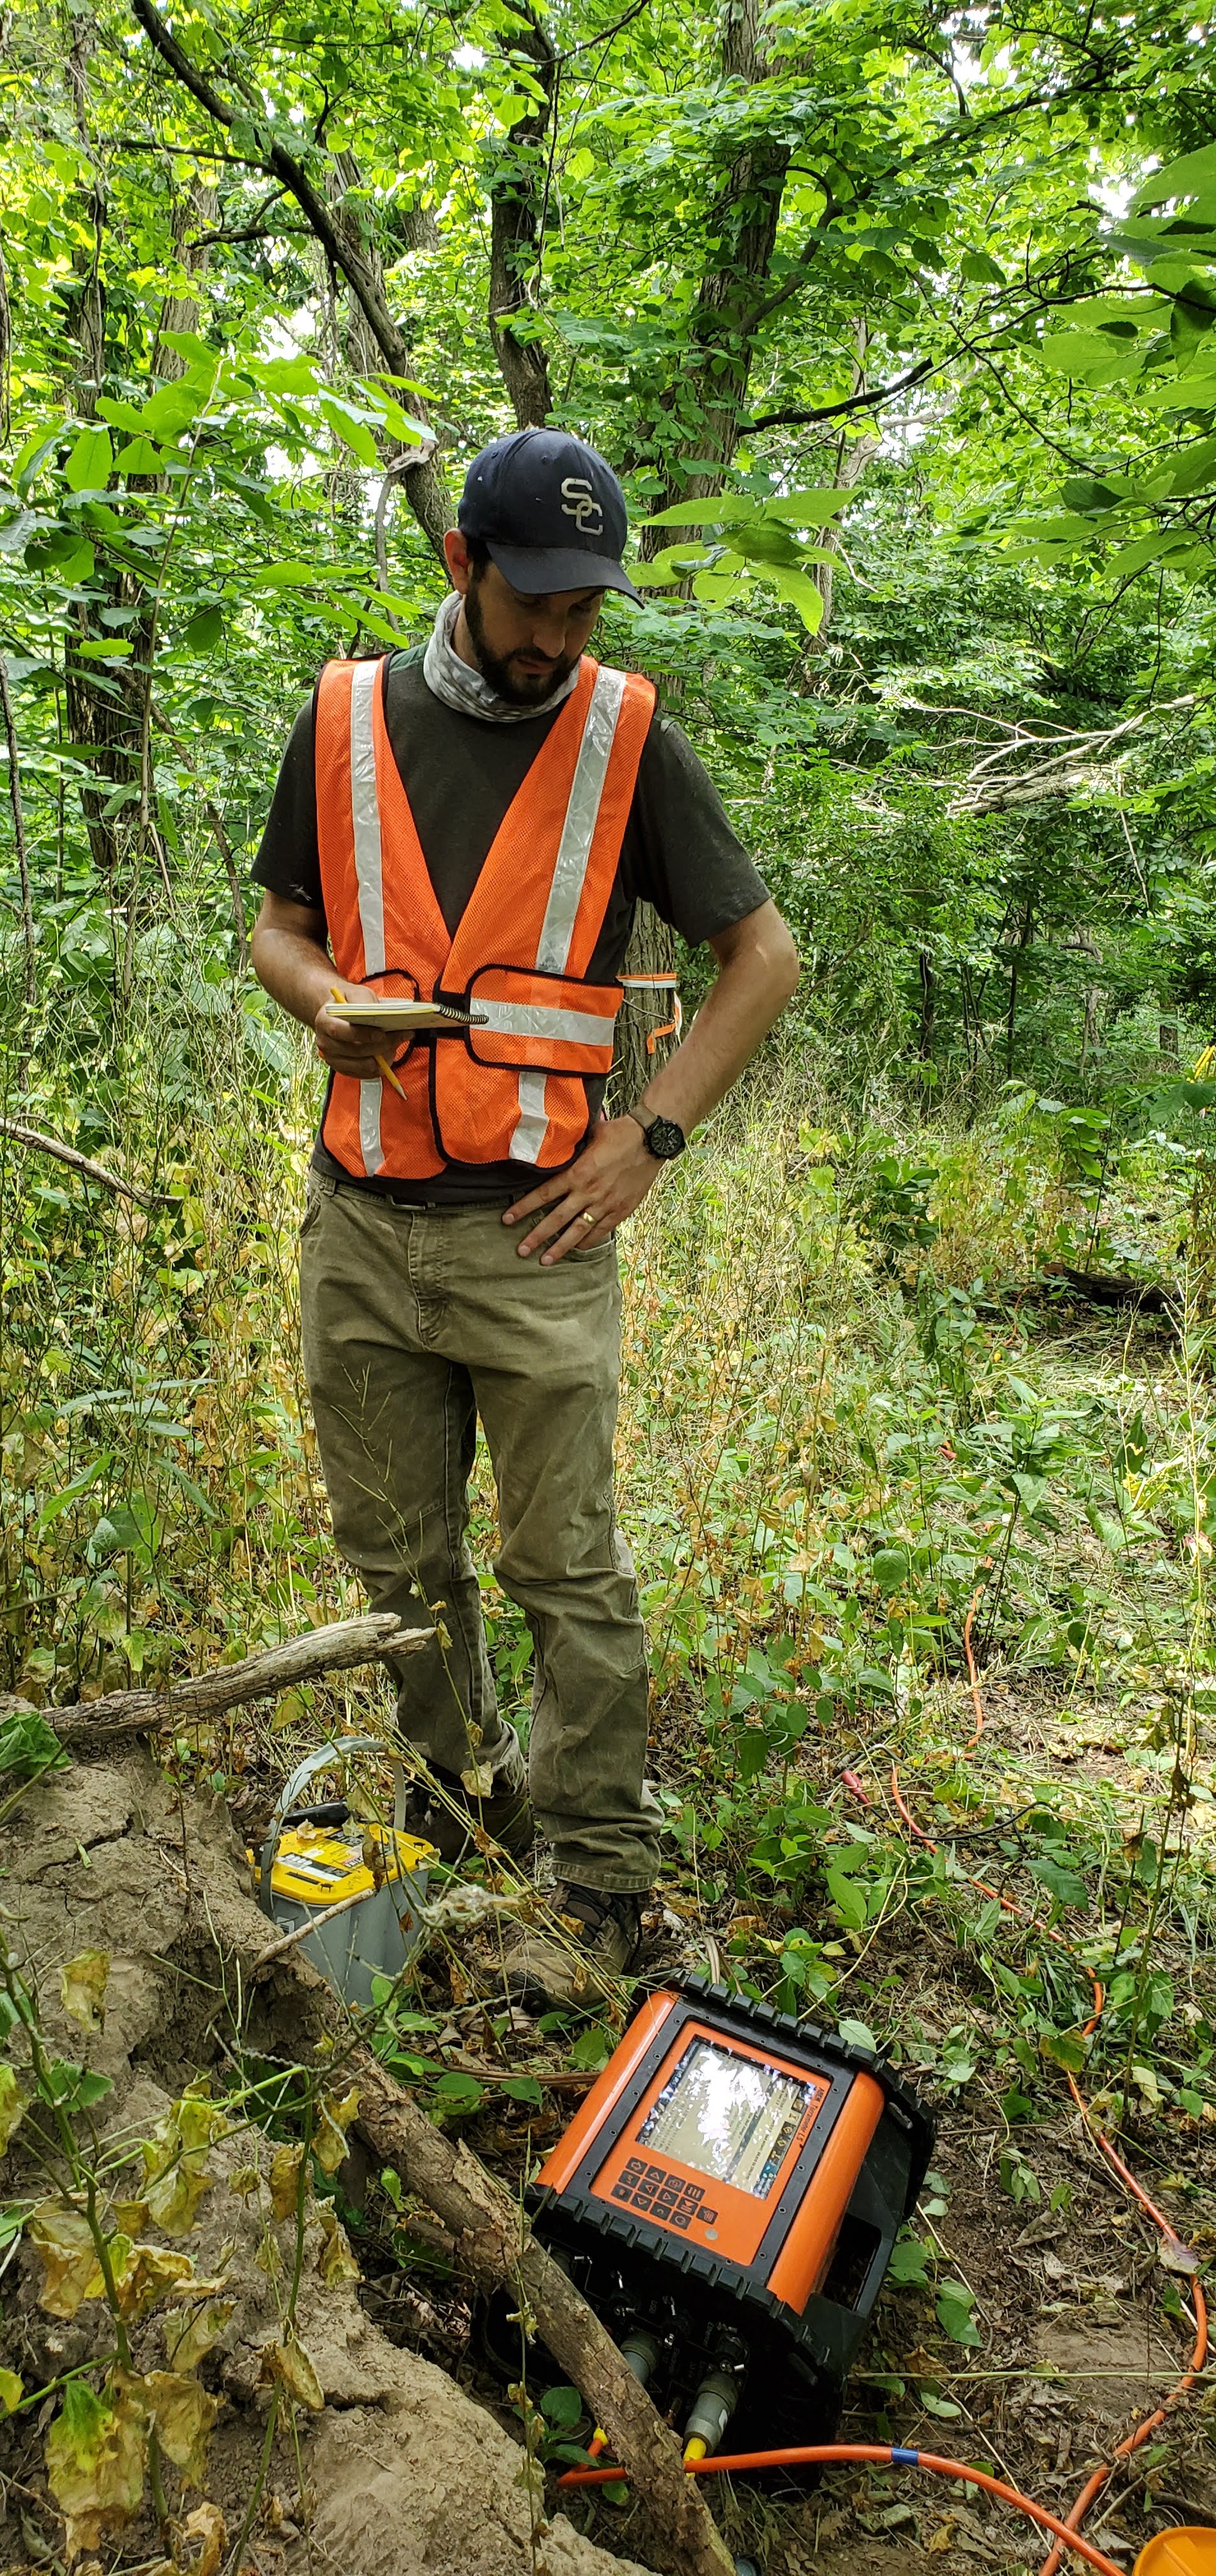
At the start of the year, we thought we had identified a place in the river where groundwater is coming into the river. In order to confirm this, several other types of geological and geophysical data has been collected. Shown in the pictures above is where I played the biggest role. We had been collecting electrical resistivity data along both sides of the river, along the river bed itself, and (as in the picture) with a few transverse cross-sections. Each of these required a different set of skills, equipment, and labor. Shown in the picture is my colleague Tim, I am taking the picture (along with helping to set up and run the equipment), and not pictured is Shaina, who was also helping to get the equipment all set up and ready to roll.
Surface Waves and Underground Coal Mines
Our second field project of the year merged something old and something new.
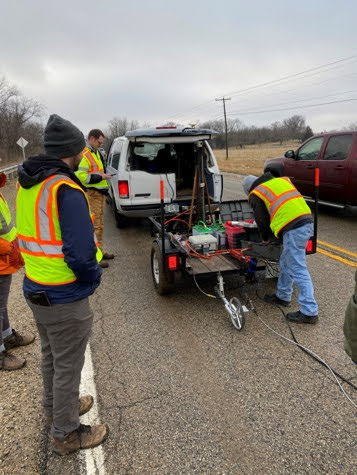
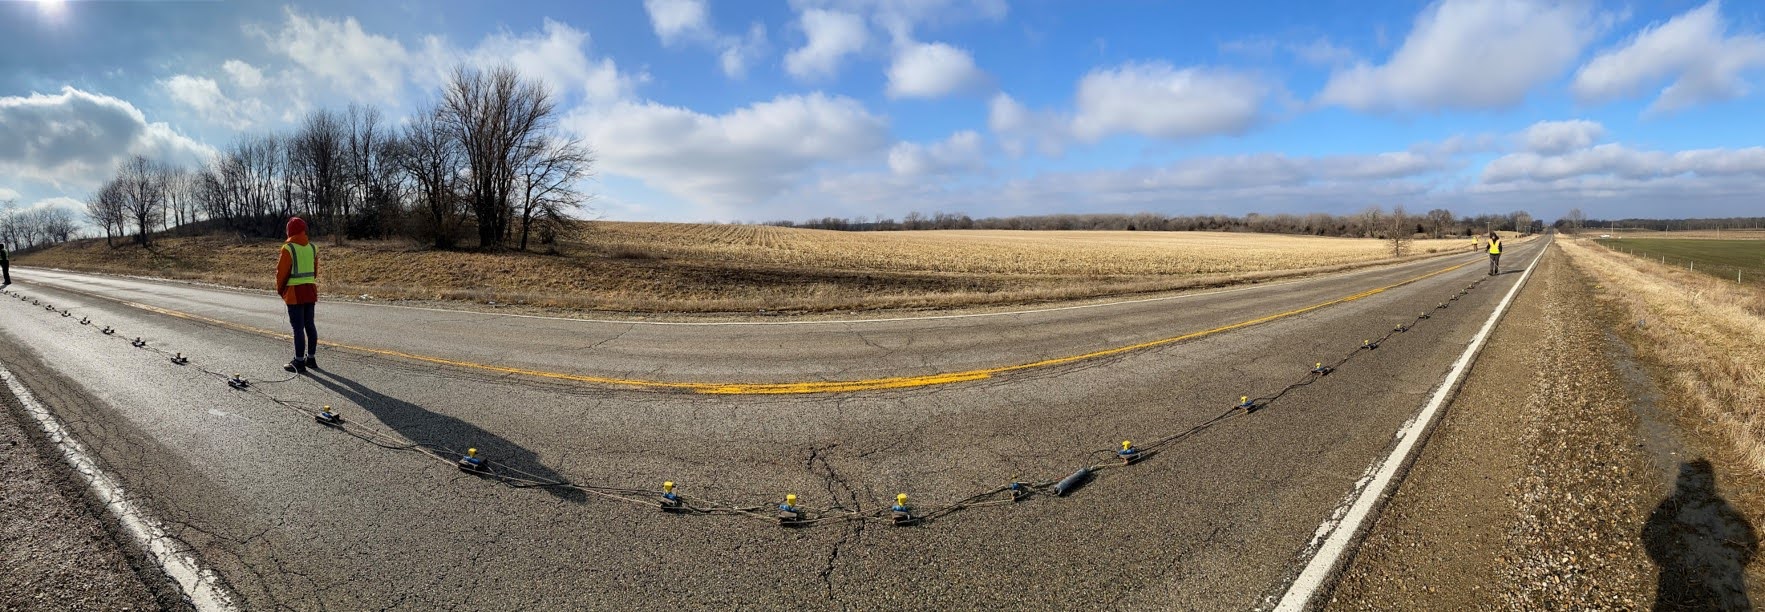
A “landstreamer” seismic acquisition system had been imagined, designed, and constructed by Steve (the only one in the picture on the left actually doing work). It had been put to extensive use in the past, but has only been used a few times in the last year or two as the seismic program has shrunk due to budget cuts and staff changes. We still do have a fair amount of expertise in seismic data acquisition and analysis, and when the right situation arises, we can get some pretty awesome work done. Near the end of 2019, we were approached by the Illinois Department of Transportation (IDOT) for one such project.
Sheffield, IL was a coal boom town in a former life. Now, most of the easy-to-get coal has been mined, and whatever hasn’t does not require the same manpower that it use to. Through much of this region, a type of mining called room-and-pillar was used extensively. In room-and-pillar mining, all the coal in a seam is mined away (the “room”) around a “pillar” of coal that helps maintain the structural integrity of the mine. Over time, however, the landscape over a room-and-pillar mine can give away, and pock-marks may start to appear along the surface. This can create problems, particularly because the exact spatial location and extent of the mines are often not known. More than a century later when a road or highway is built in the area (like the one pictured above), there is often no direct way of knowing what lays beneath the road’s foundation.
The two-lane highway pictured above was beginning to sink in one specific location. IDOT did not know the extent of the damage, and that is where we came in. Using the landstreamer, we used a geophysical method called Multichannel Analysis of Surface Waves (MASW) to measure the subsurface integrity. MASW relies on the fact that different seismic wavelengths travel at certain speeds and certain depths. We measure the speed and wavelength of seismic waves, and we can get an idea of the wave velocity at different depths. (We create these seismic waves ourselves using something like a motorized, vertical battering ram that we pound against an iron plate on the road surface.) With this information, we can make a plot of seismic wave velocity against depth. If we do a bunch of these in a row (which we did), we can make a 2-D plot out of seismic wave velocity, which can tell us a lot about the structural integrity of the subsurface.
We were able to collect and process more than a hundred of these points, and strung them together to create a relatively high resolution image of the ground under the roadway. We identified several places of concerns for IDOT to monitor, and imaged the underlying cause of the trouble area. Overall, it was highly successful.
It was also the last field work before I took a scheduled leave at the start of February 2020, and was scheduled to return to work on March 26.
Then the whole world turned upside down.
Lockdown
Spring 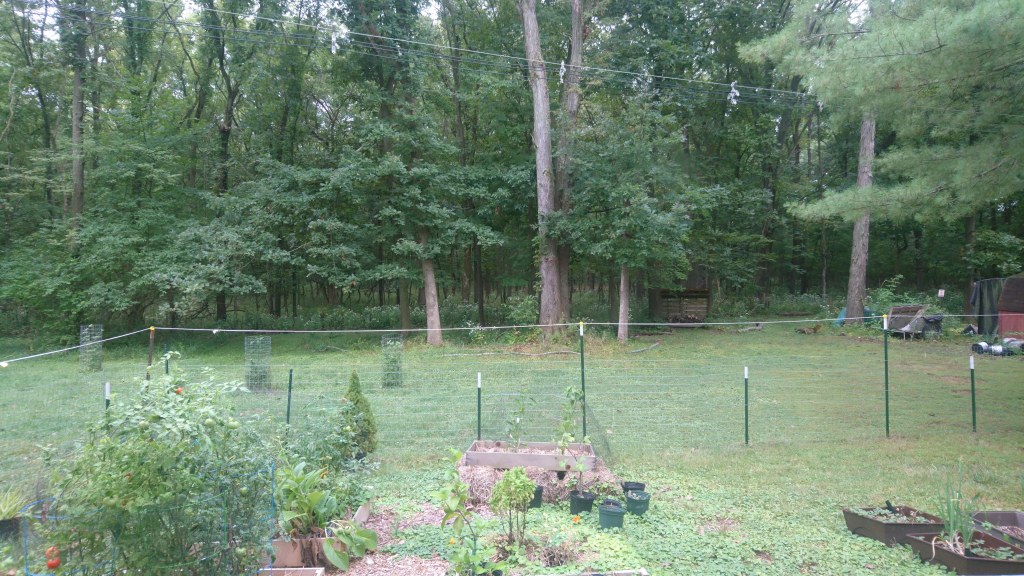
Summer 
Fall 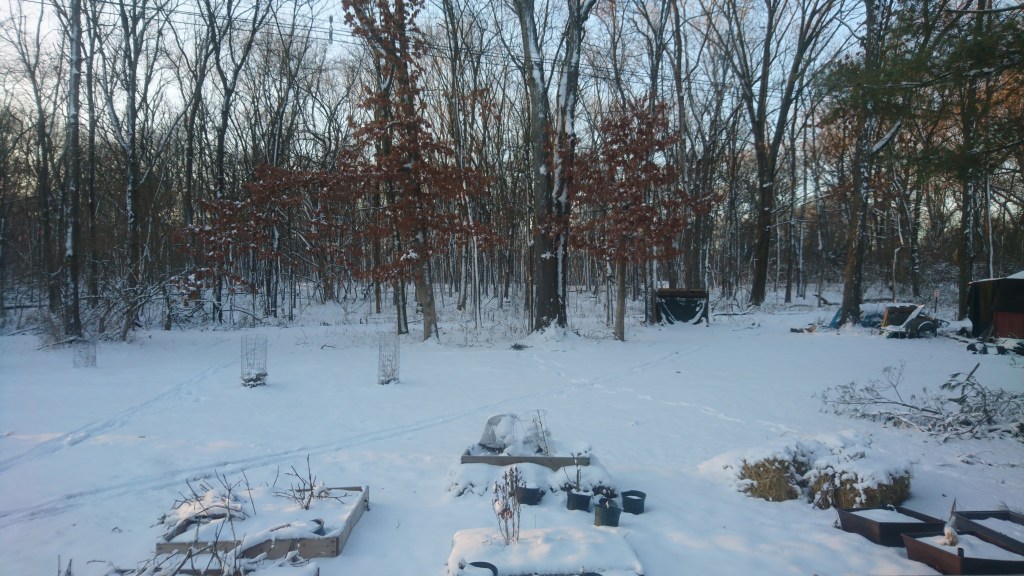
Winter
A few scattered reports of a strange, flu-like disease spreading in China hit the news. A few smatterings of cases in other countries around the world. At some point Italy was in the news every day. Things began to snowball. Somebody in the United States died, but it didn’t appear to be spreading locally, at least that we knew of. And there was a cruise ship languishing off the coast until we could set up a quarantine. It was a bit of a blur, and even more so because my daily routines that included checking in on the news were interrupted while on leave. It was all a bit blurry, a bit unclear.
And then we saw and read about the apocalyptic scenes in New York.
A family member works in the Emergency Department at one of the largest hospitals in Illinois, so the faraway stories of New York were not faraway for long. At that hospital, the ER filled up. The protective equipment was in short supply. Items that were made to be disposed after use with a single, sick patient were having to be reused for entire 12-hour shifts. We had been repainting our house the previous year and had most of a contractor pack of N95s left. A couple of these masks were used in work rotation at the ER, and we donated several to frontline workers in the ER.
I was hungry for information, as was the rest of the world. The understanding of the virus, the symptoms, the effects, the causes, the best mitigation efforts…were all morphing as the scientific studies progress and understanding matured. I read preprints of papers in journals in various fields of biology. I followed Twitter accounts of virologists. Fortunately, I have the tools and training to at least get an idea of some semblance of the emerging scientific knowledge, to separate the wheat from the chaff. Many do not.
Misinformation spread like wildfire. Powerful people were irresponsible in their response, and even more irresponsible with their words. Opinion-peddlers on the radio and television stretched the truth to cheer on their side, even as we all faced what should have been a common enemy. Strangers, acquaintances, friends, and extended family members repeated (false) notions they had heard on TV. The disease became political. Political party became one of the best predictors of participation and belief in the most basic and proven preventive measures.
And the disease continued to spread.
Most of the battles were being fought away from the public eye. Nurses, PAs, physicians were begging people to take things seriously. I heard it said somewhere that we were fighting World War II with the public support at the end of the Vietnam War.
Meanwhile, the disease continued to spread and the country began to close down.
2020 became the year of the lockdown.
I had been expecting to get back to work on March 23, but I received an email a week or two prior that remote work would be mandatory starting that very day.
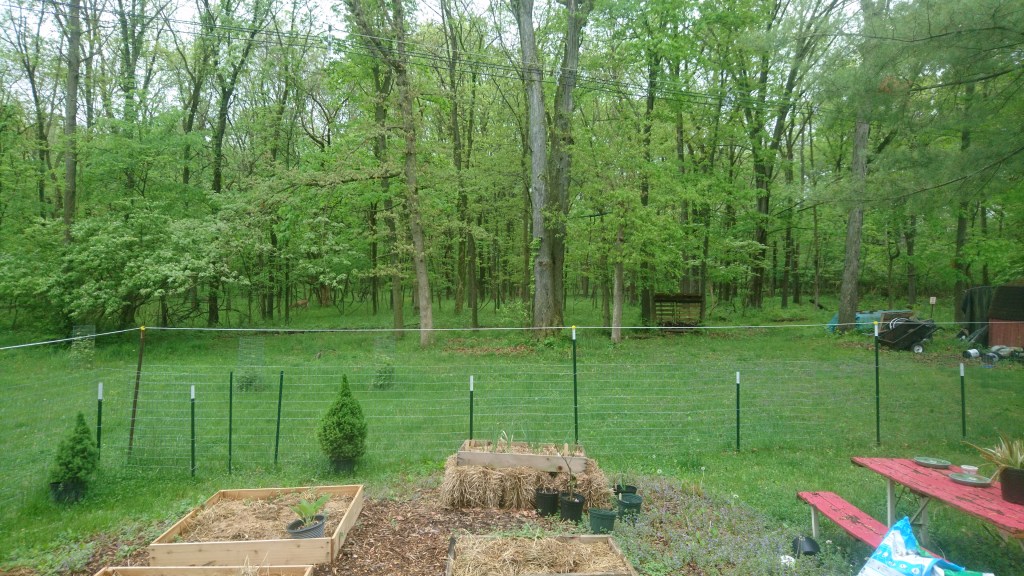
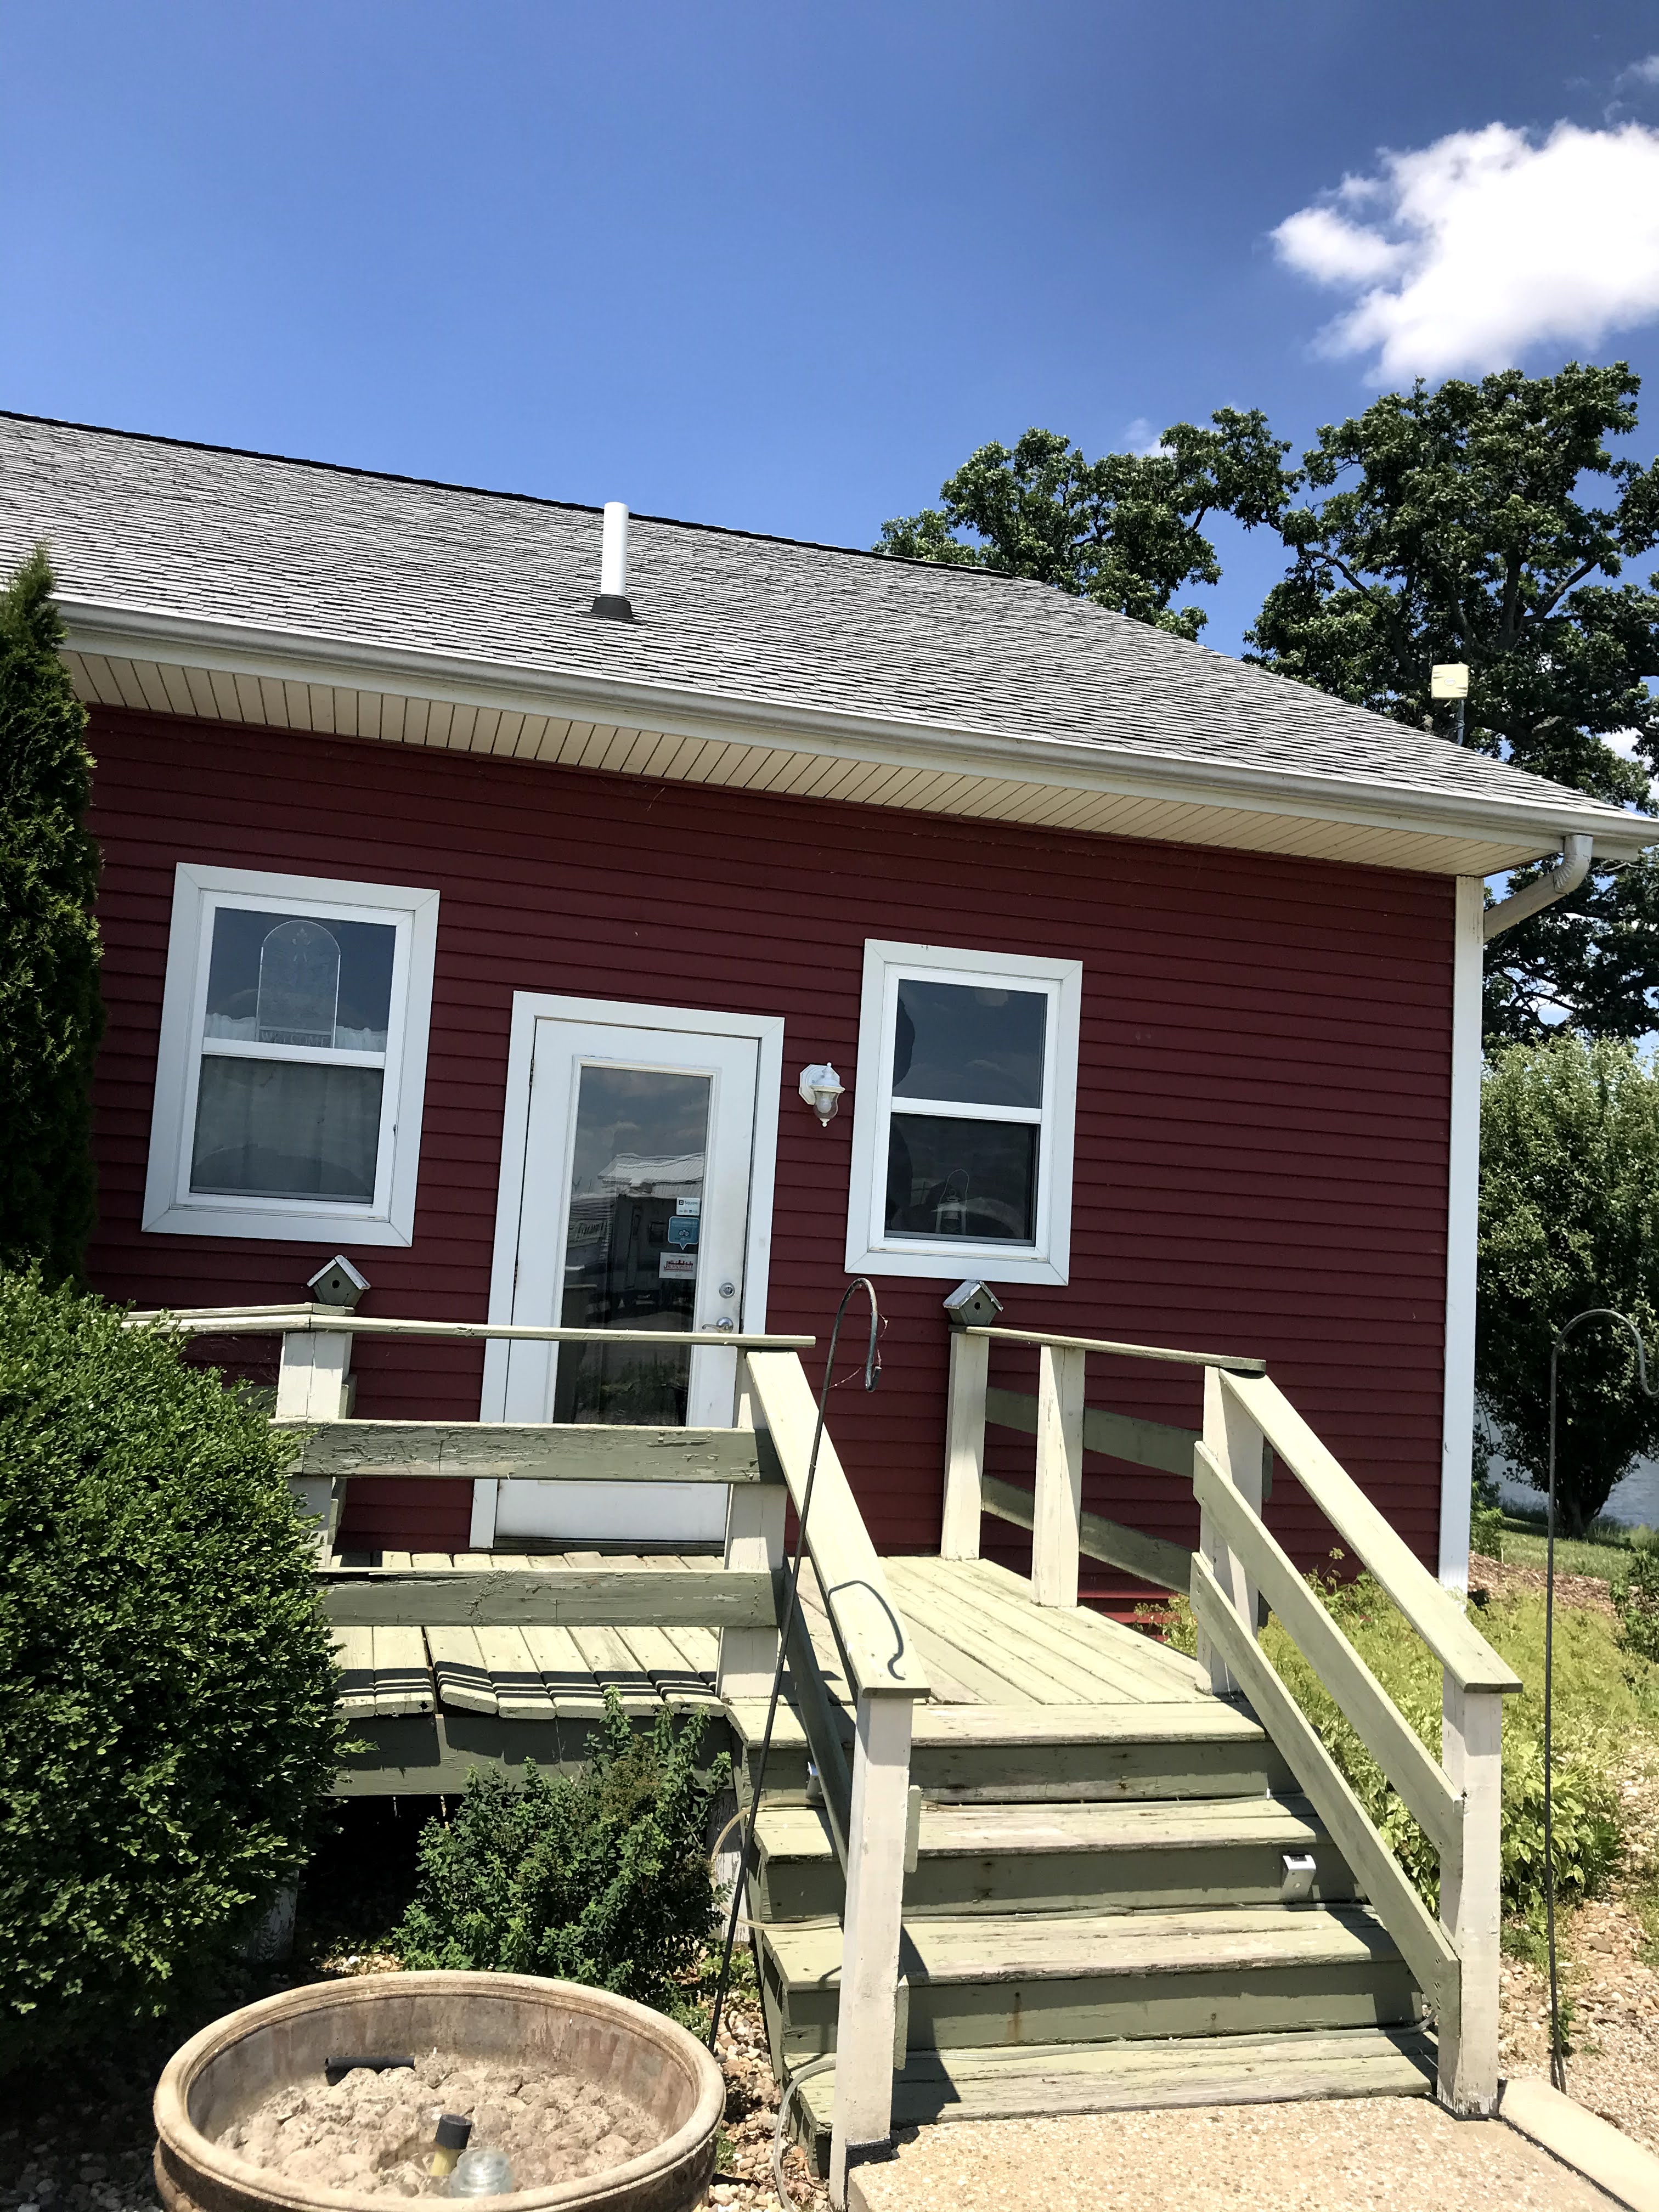
I have been fortunate. Not only have I been able to continue to work from home, I’ve been lucky to be with my family during this trying time. We were able to get a decent garden going. And I have a great view from my home office, and we have now been through four seasons (above).
Our family took the lockdown very seriously, in part because of our connection with ER workers. I did not see the inside of a building other than my home for more than a month at a time. I got used to using a VPN, remote desktops, Microsoft Teams, working from laptops. I was fortunate to have volunteered in a national organization where we had been using Zoom weekly for years, so I had a bit of a leg up in that regard. In any case, when our research institute reopened field-based research again with COVID mitigation efforts in place, I was happy to get out and cut into the workload that had been piling up.
Return to Research
Although the logistics of the project looked very different than usual (e.g., one person per car, staying in a single-occupancy cabin, mask use in the field), the science itself was familiarly comfortable.
The first project we worked on was a collaboration with the Illinois Department of Transportation (IDOT). On the edge of the Illinois River Valley near Jacksonville, IL, a creeping landslide had been spilling onto a heavily-trafficked highway. The road itself had been dug into weathered sandstone, but there were tens of feet of loess, sand, and other Quaternary sediment on top of the bedrock that was not as stable. We worked with IDOT to establish where we thought stable bedrock might be. They had drilled a few borings, but we were able to “connect the dots” using electrical-resistivity tomography (ERT), a type of geophysics method that uses the natural variation in electrical properties of geologic materials to image the subsurface.
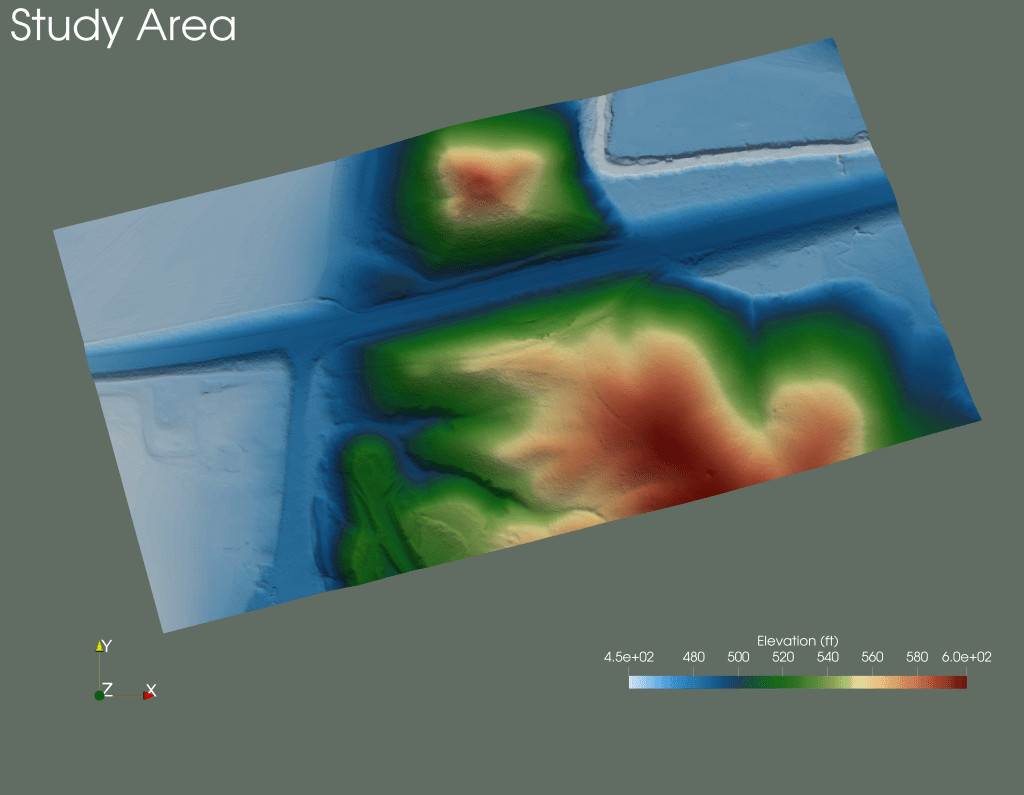
LiDAR-Derived Topography of Study Area. Blue, flat area is road. Landslide scarp can be seen on south side of road. 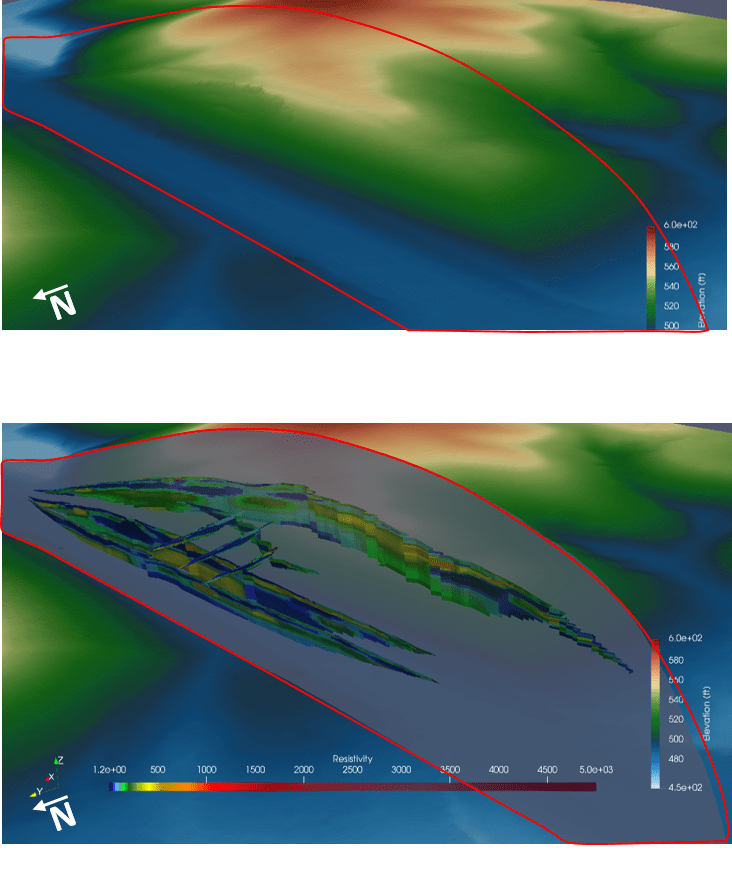
Oblique view of land surface, with land cut away to show ERT profiles. 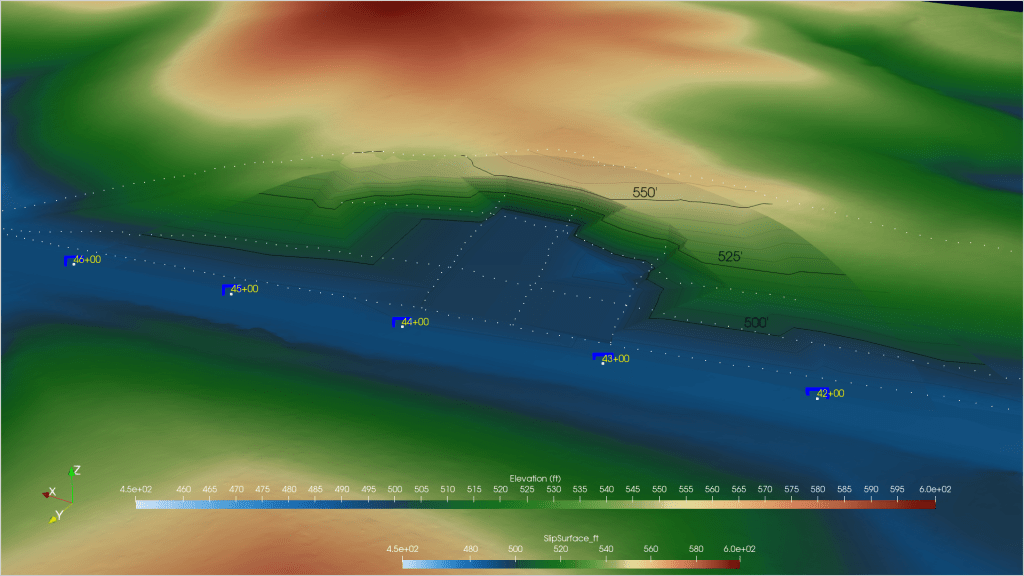
Oblique view of LiDAR-derived topography, with cutaway showing a rough estimate of slip surface we found using electrical resistivity geophysics
A Littler River in the Oil Patch
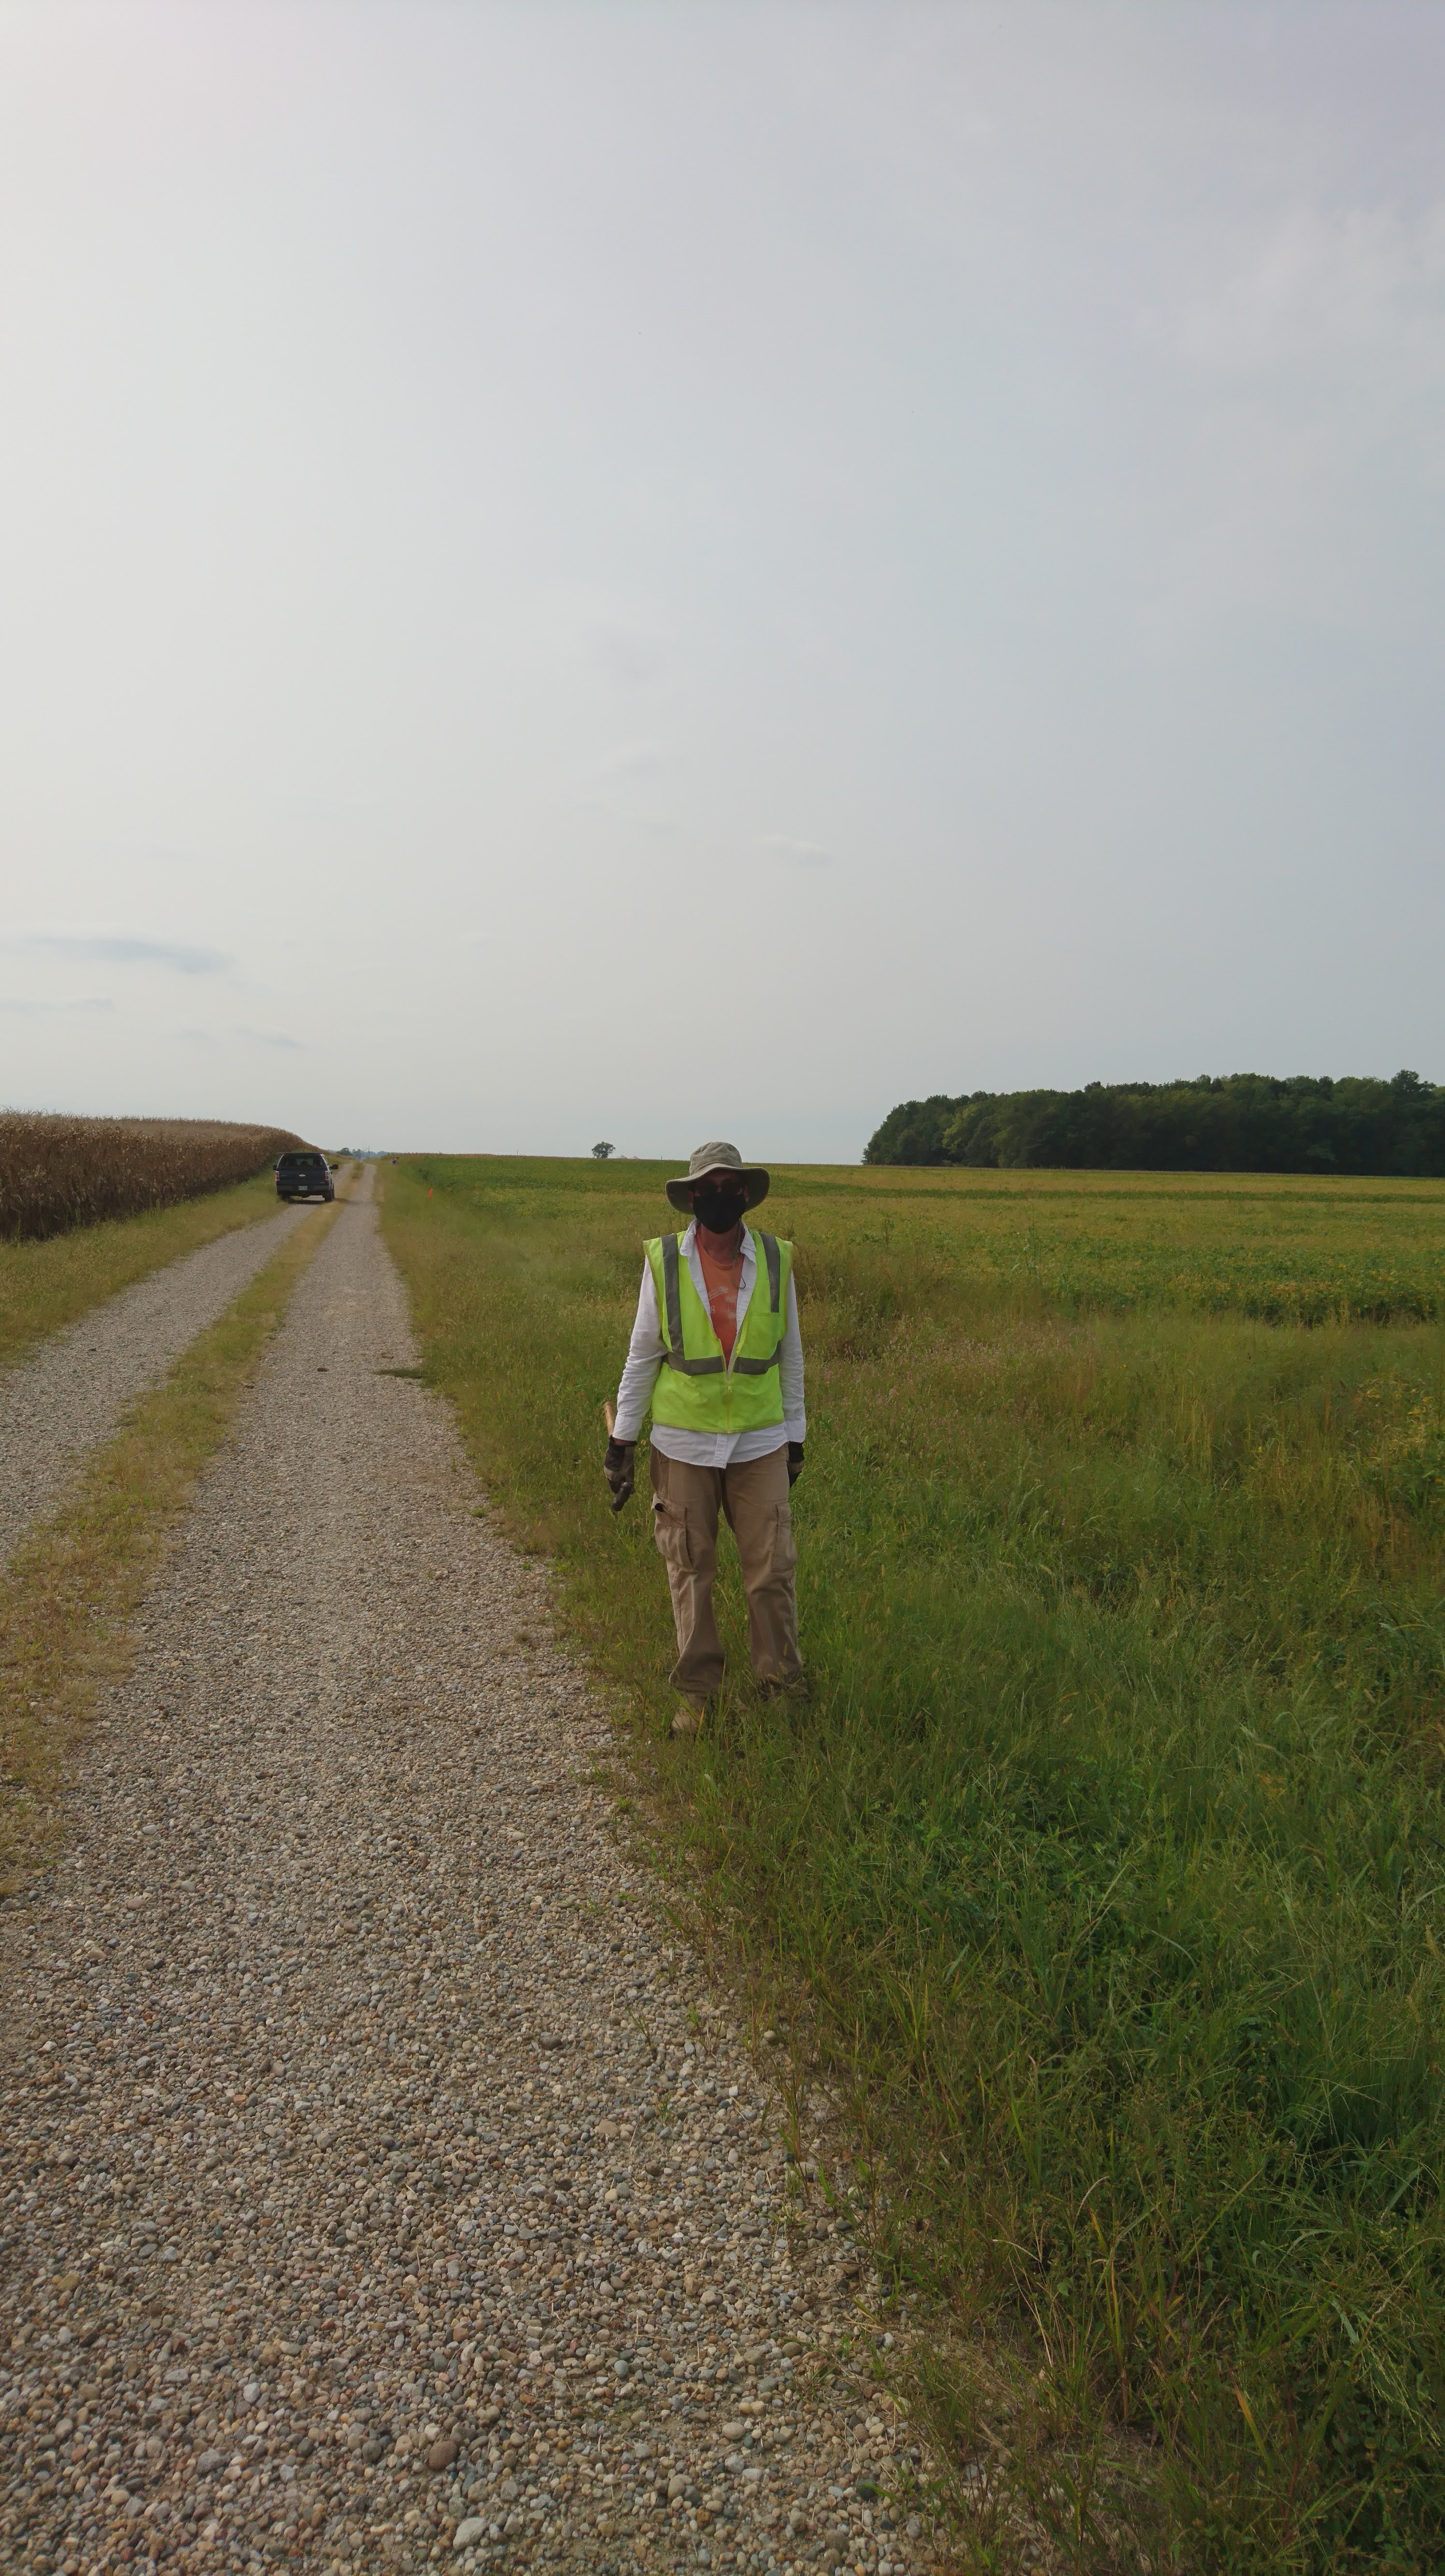
Colleague (Tim) setting up ERT equipment 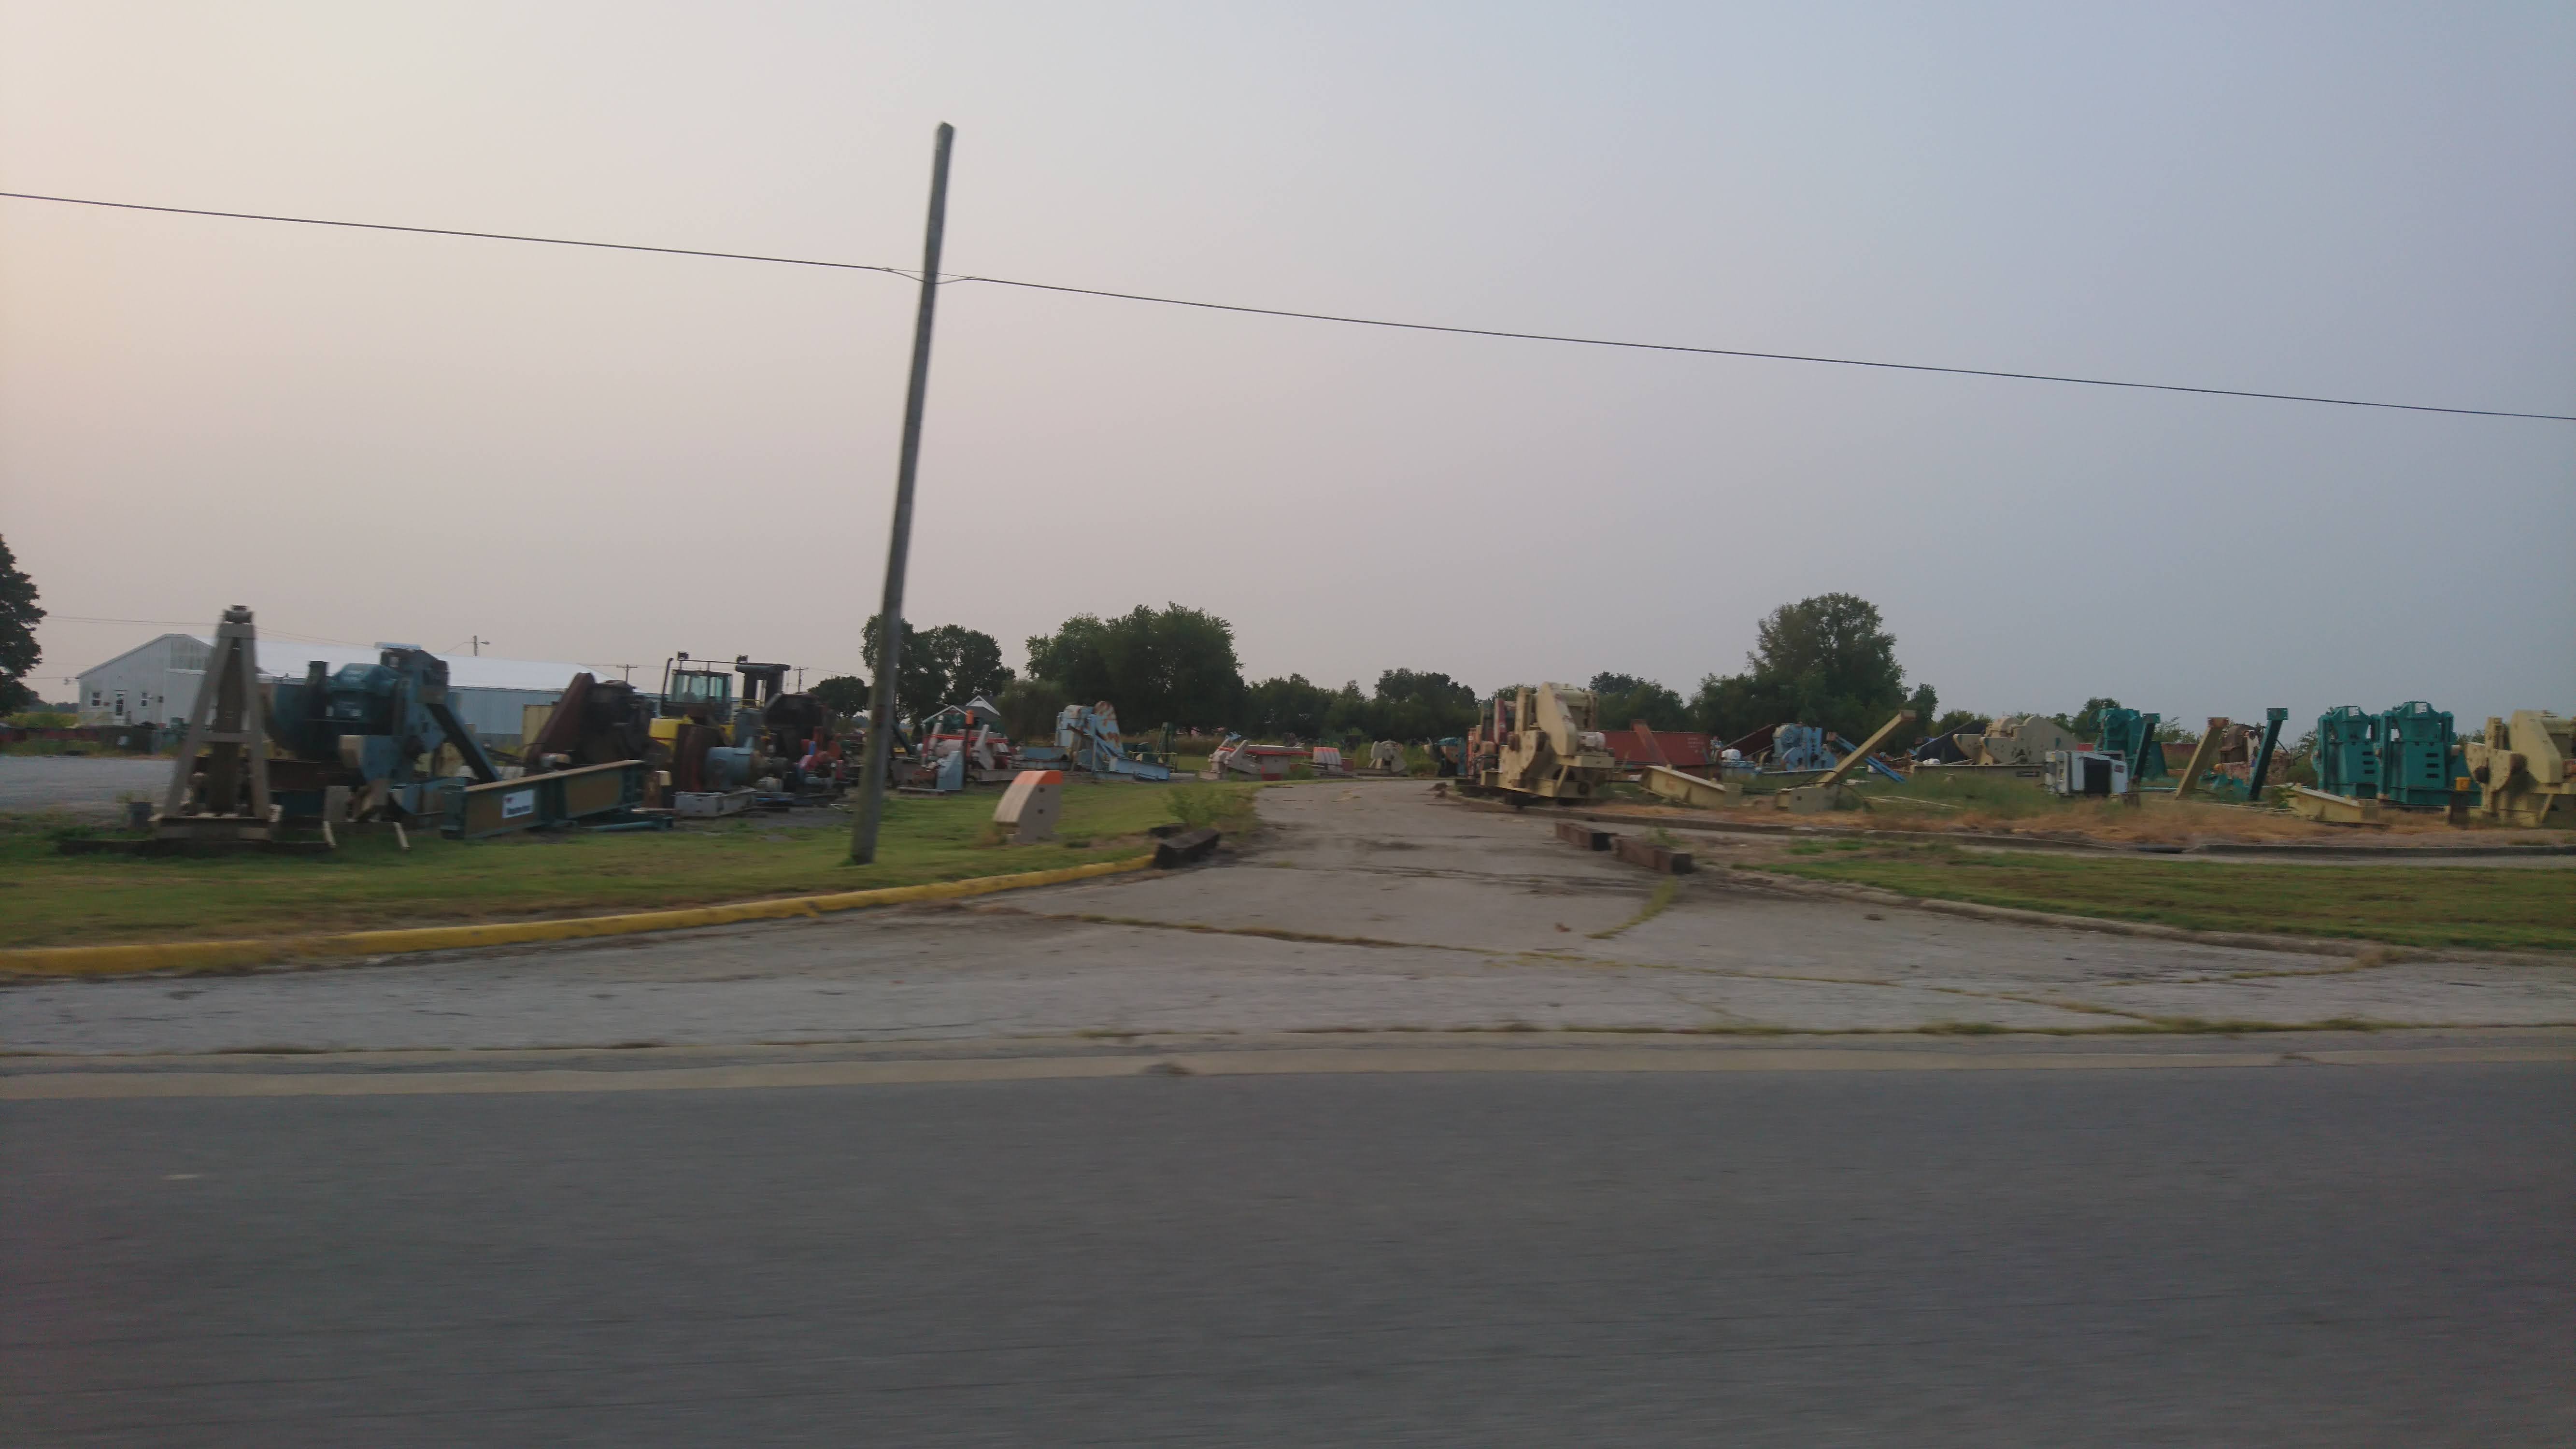
Abandoned oil field machinery 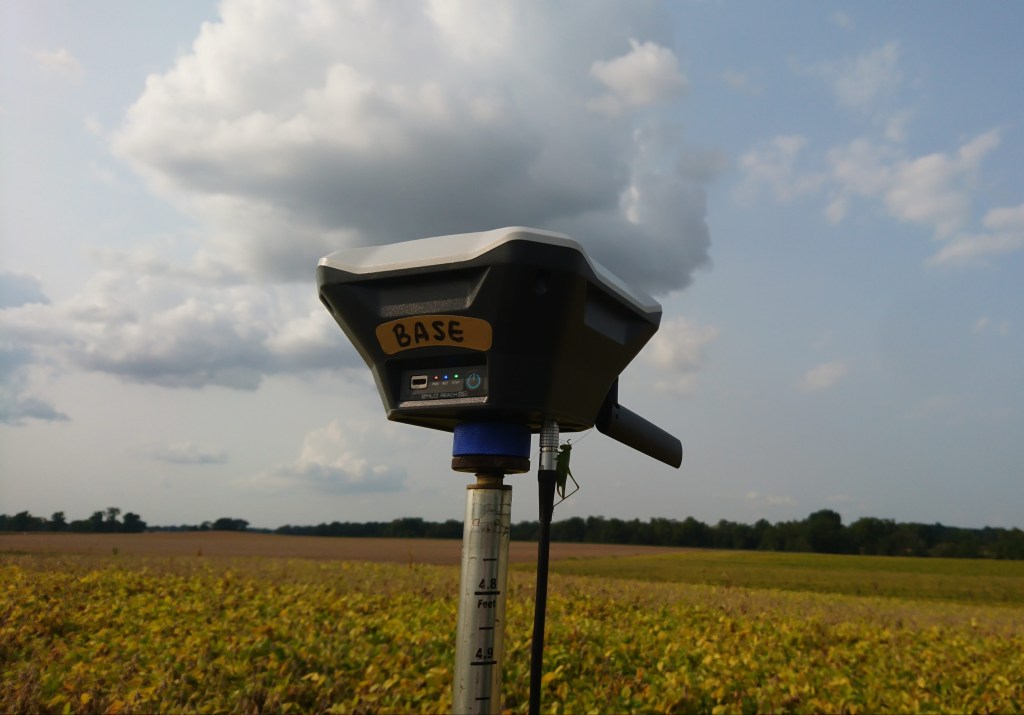
GPS Base 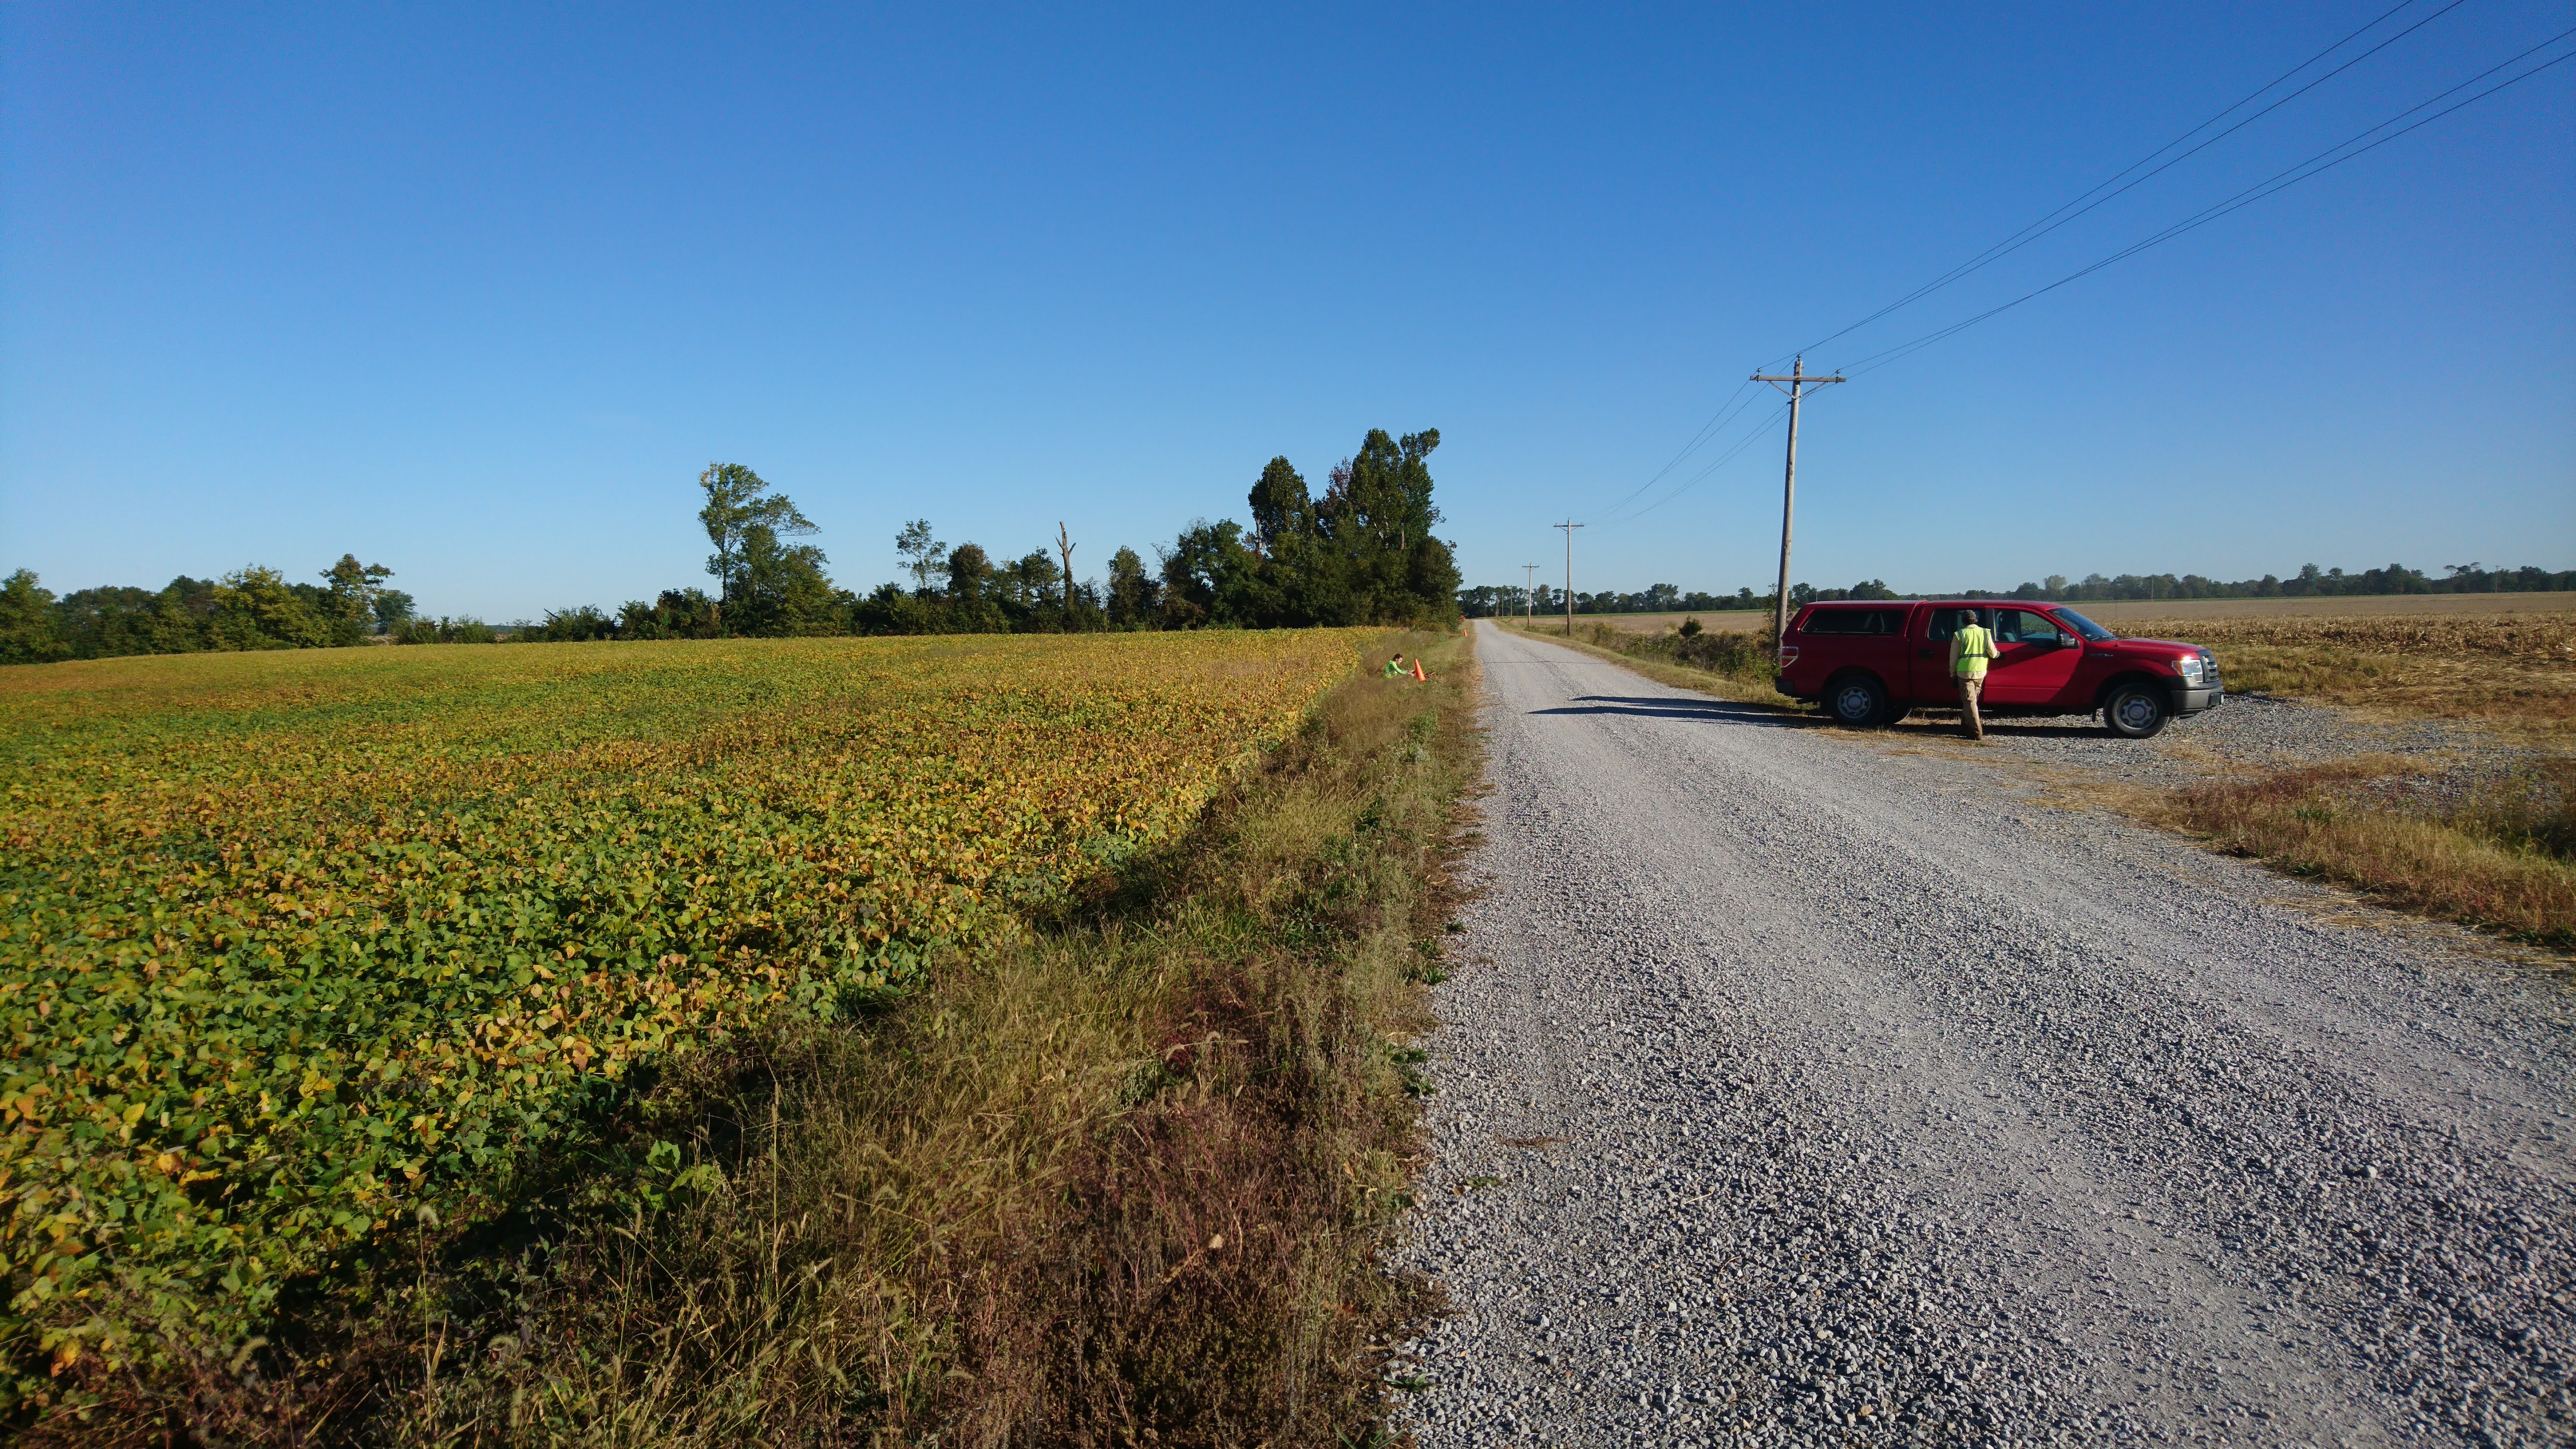
ERT along gravel roadway 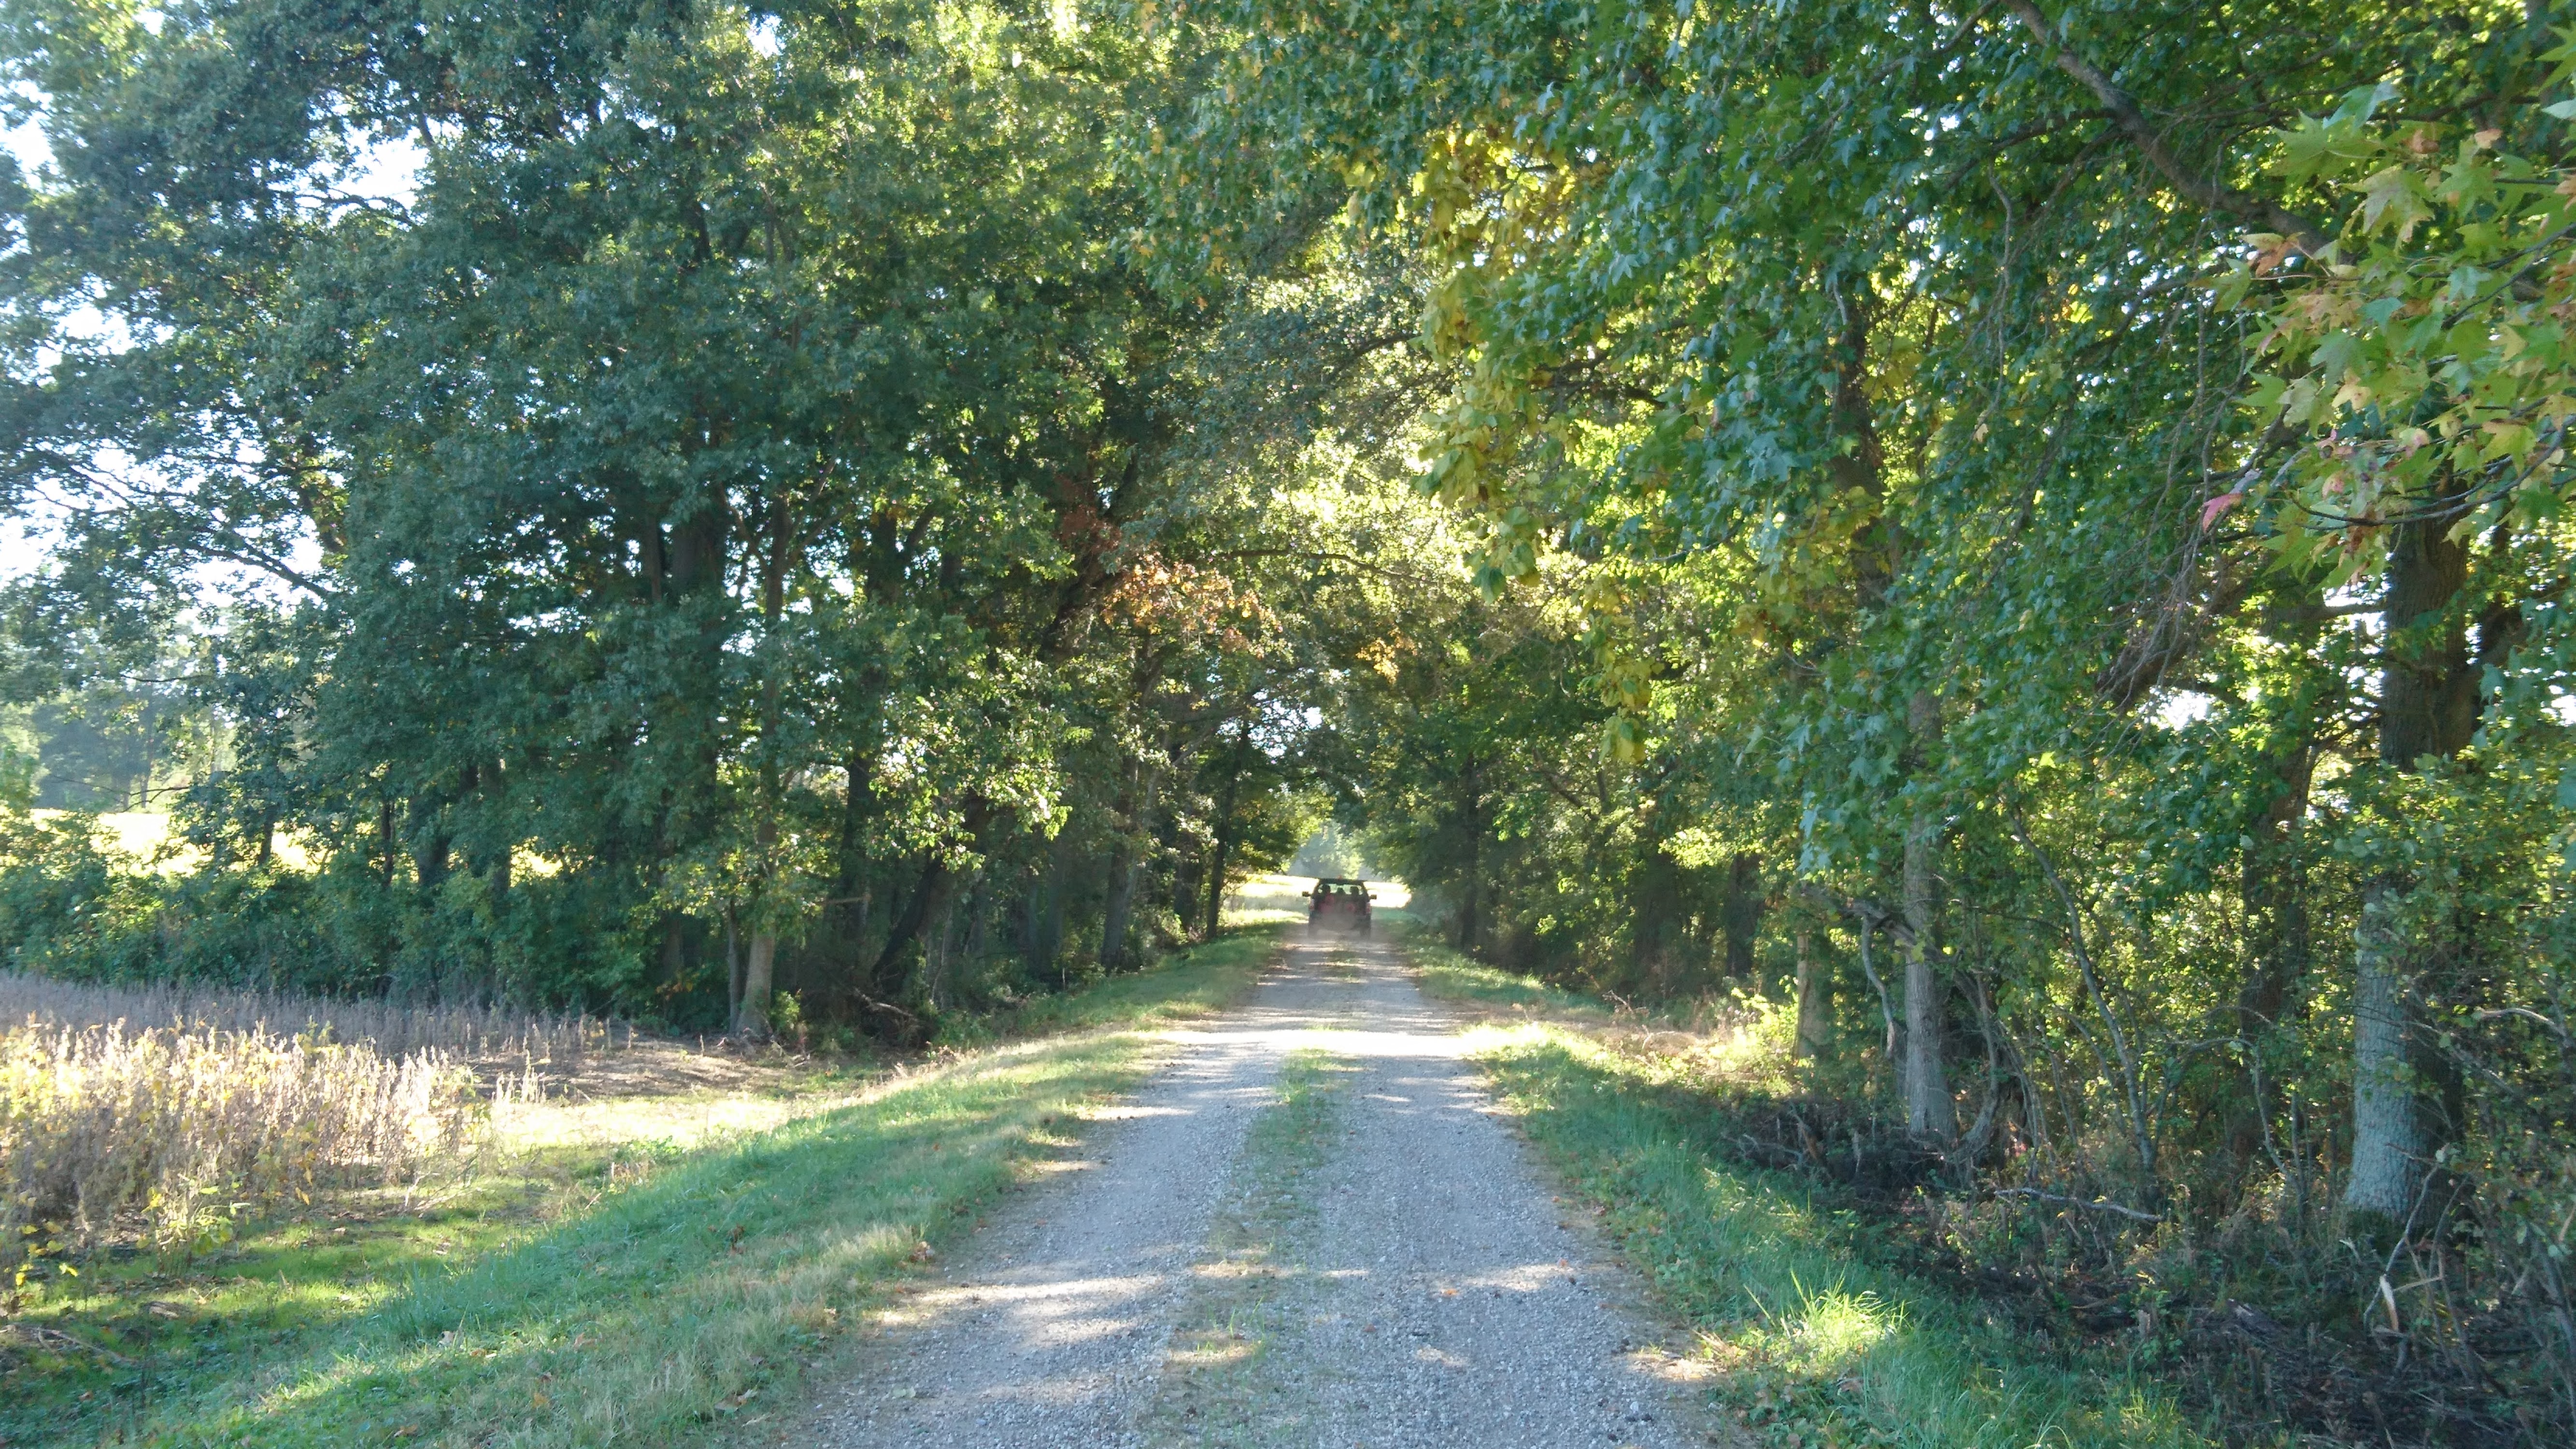
Beautiful scenery along the way
As part of a geologic mapping effort at the end of the summer, we made a few trips to southeastern Illinois. Firmly within the oil field of the Illinois Basin, there was oil machinery everywhere. At least one of our ERT profiles was highly corrupted as the electrodes passed near an abandoned oil well. We had to constantly change our plans as we discovered old well pads, old house foundations, electrical and water lines, and a centuries-old cemetery.
Along with our normal data collection, we were also testing out a new (to us) GPS system. This GPS system uses a real-time kinematic (RTK) processing that requires the use of two satellite receivers: one of the receivers (known as the “base,” imaged above) has the primary purpose of correcting the signal of the other receiver (known as the “rover”), which is the primary receiver used for storing the geographic location of interest. These receivers are significantly more accurate than the one in your phone, for example, and when all is set up correctly, can accurately record the XYZ location of the rover within a centimeter or so(!). It was definitely a learning experience, with a fair amount of errors and back-tracking. But in the end, we have a much better idea of the limitations of the new hardware, and some of the awesome possibilities it brings with it.
In any case, we were able to gather some interesting data, helping to understand the evolution of the Little Wabash River as it has morphed changed over the years from draining glaciers to occupying a small part of a relatively large valley. This area of Illinois has a longer post-colonial history than most of the state, and the landscape also has had a longer post-glacial time to evolve than a large part of the state. This area of Illinois was the first region where Euroamerican settlers came in the late 18th century. In fact, only about 10 miles from one of our sites is one of the most important cities in the history of geology in the United States.
History in New Harmony (Indiana)
Just across the Wabash River in Indiana (with Illinois still very much in sight), is the town of New Harmony. My wife and I got to visit after the field work was completed. The history of New Harmony consists of multiple iterations of attempted utopian communities, with the attendant social experiments. The first public library in the nation, for example, was founded at New Harmony. In its heyday in the early 19th century, it drew a disproportionate number of intellectuals. One of the founders, Robert Owen, only lived there for a few years in the 1820s, but several of his sons stayed behind. One of them, David Dale Owen, would establish one of the most prominent geologic laboratories and schools in the nation. In the 1830s, he began his geologic work in the region. In 1839, he led one of the largest geologic surveys in the history of the country, exploring the lead district in the northwestern Illinois, southwestern Wisconsin, and eastern Iowa.
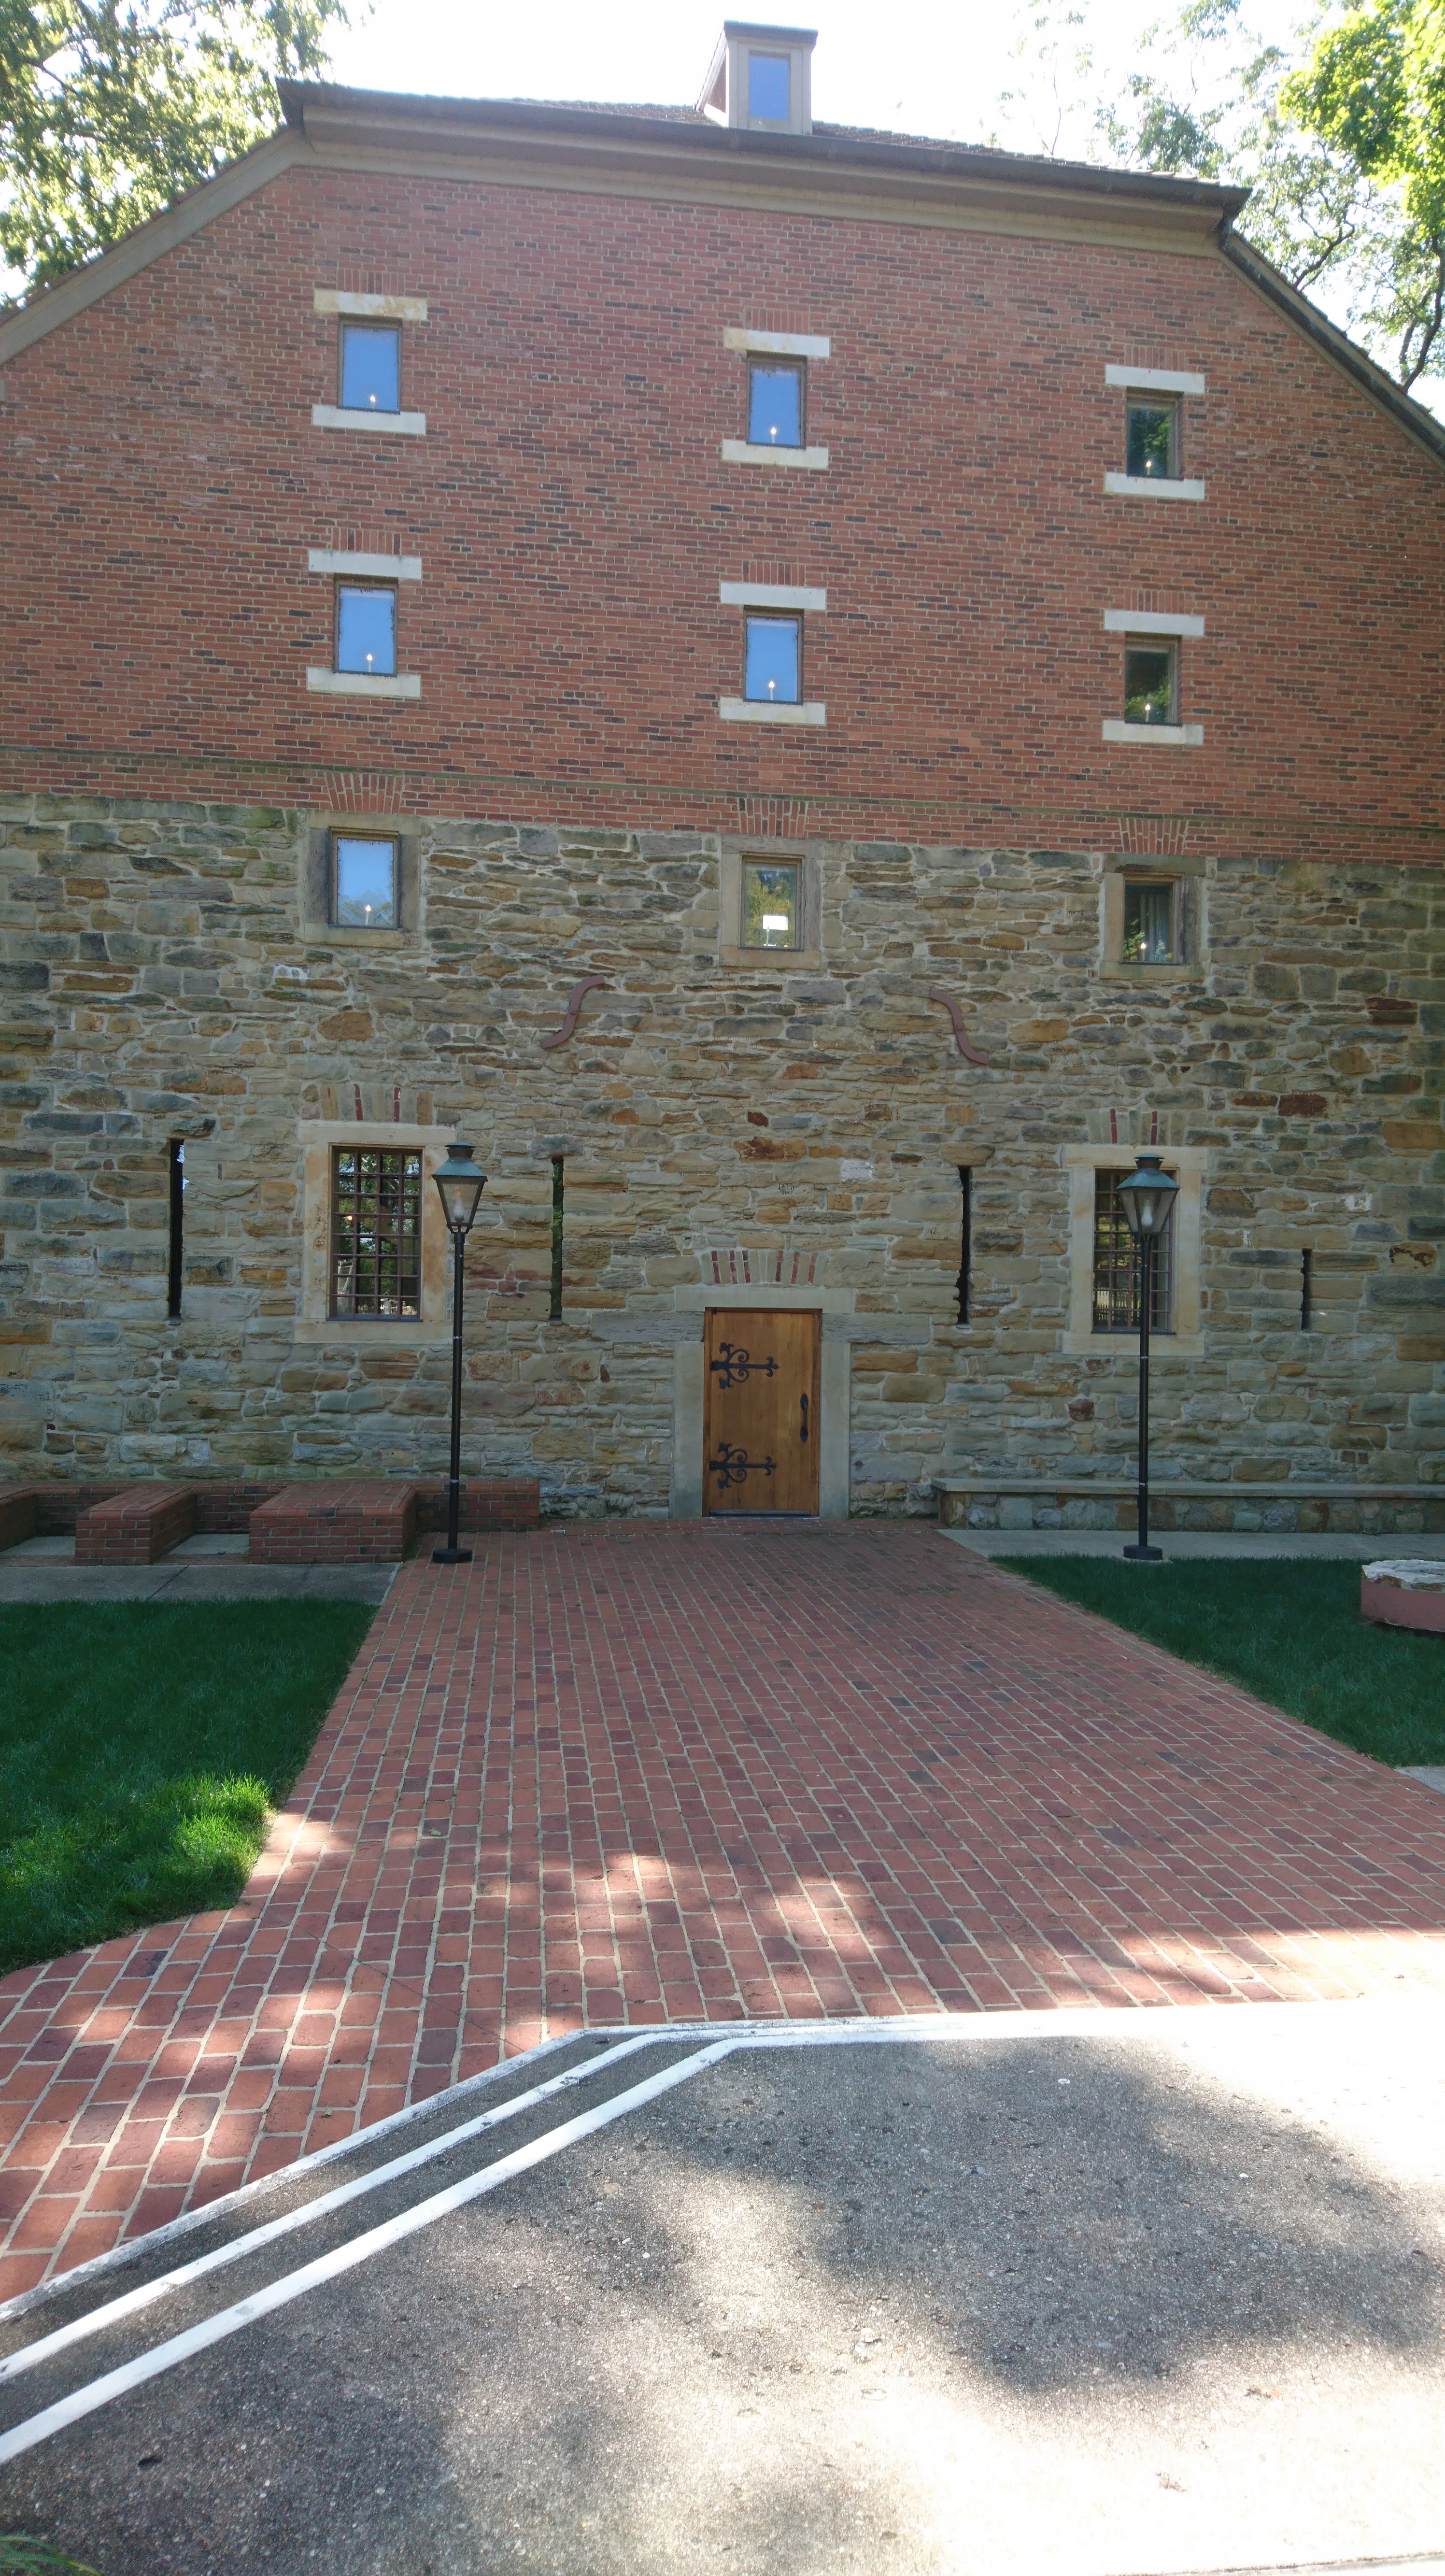
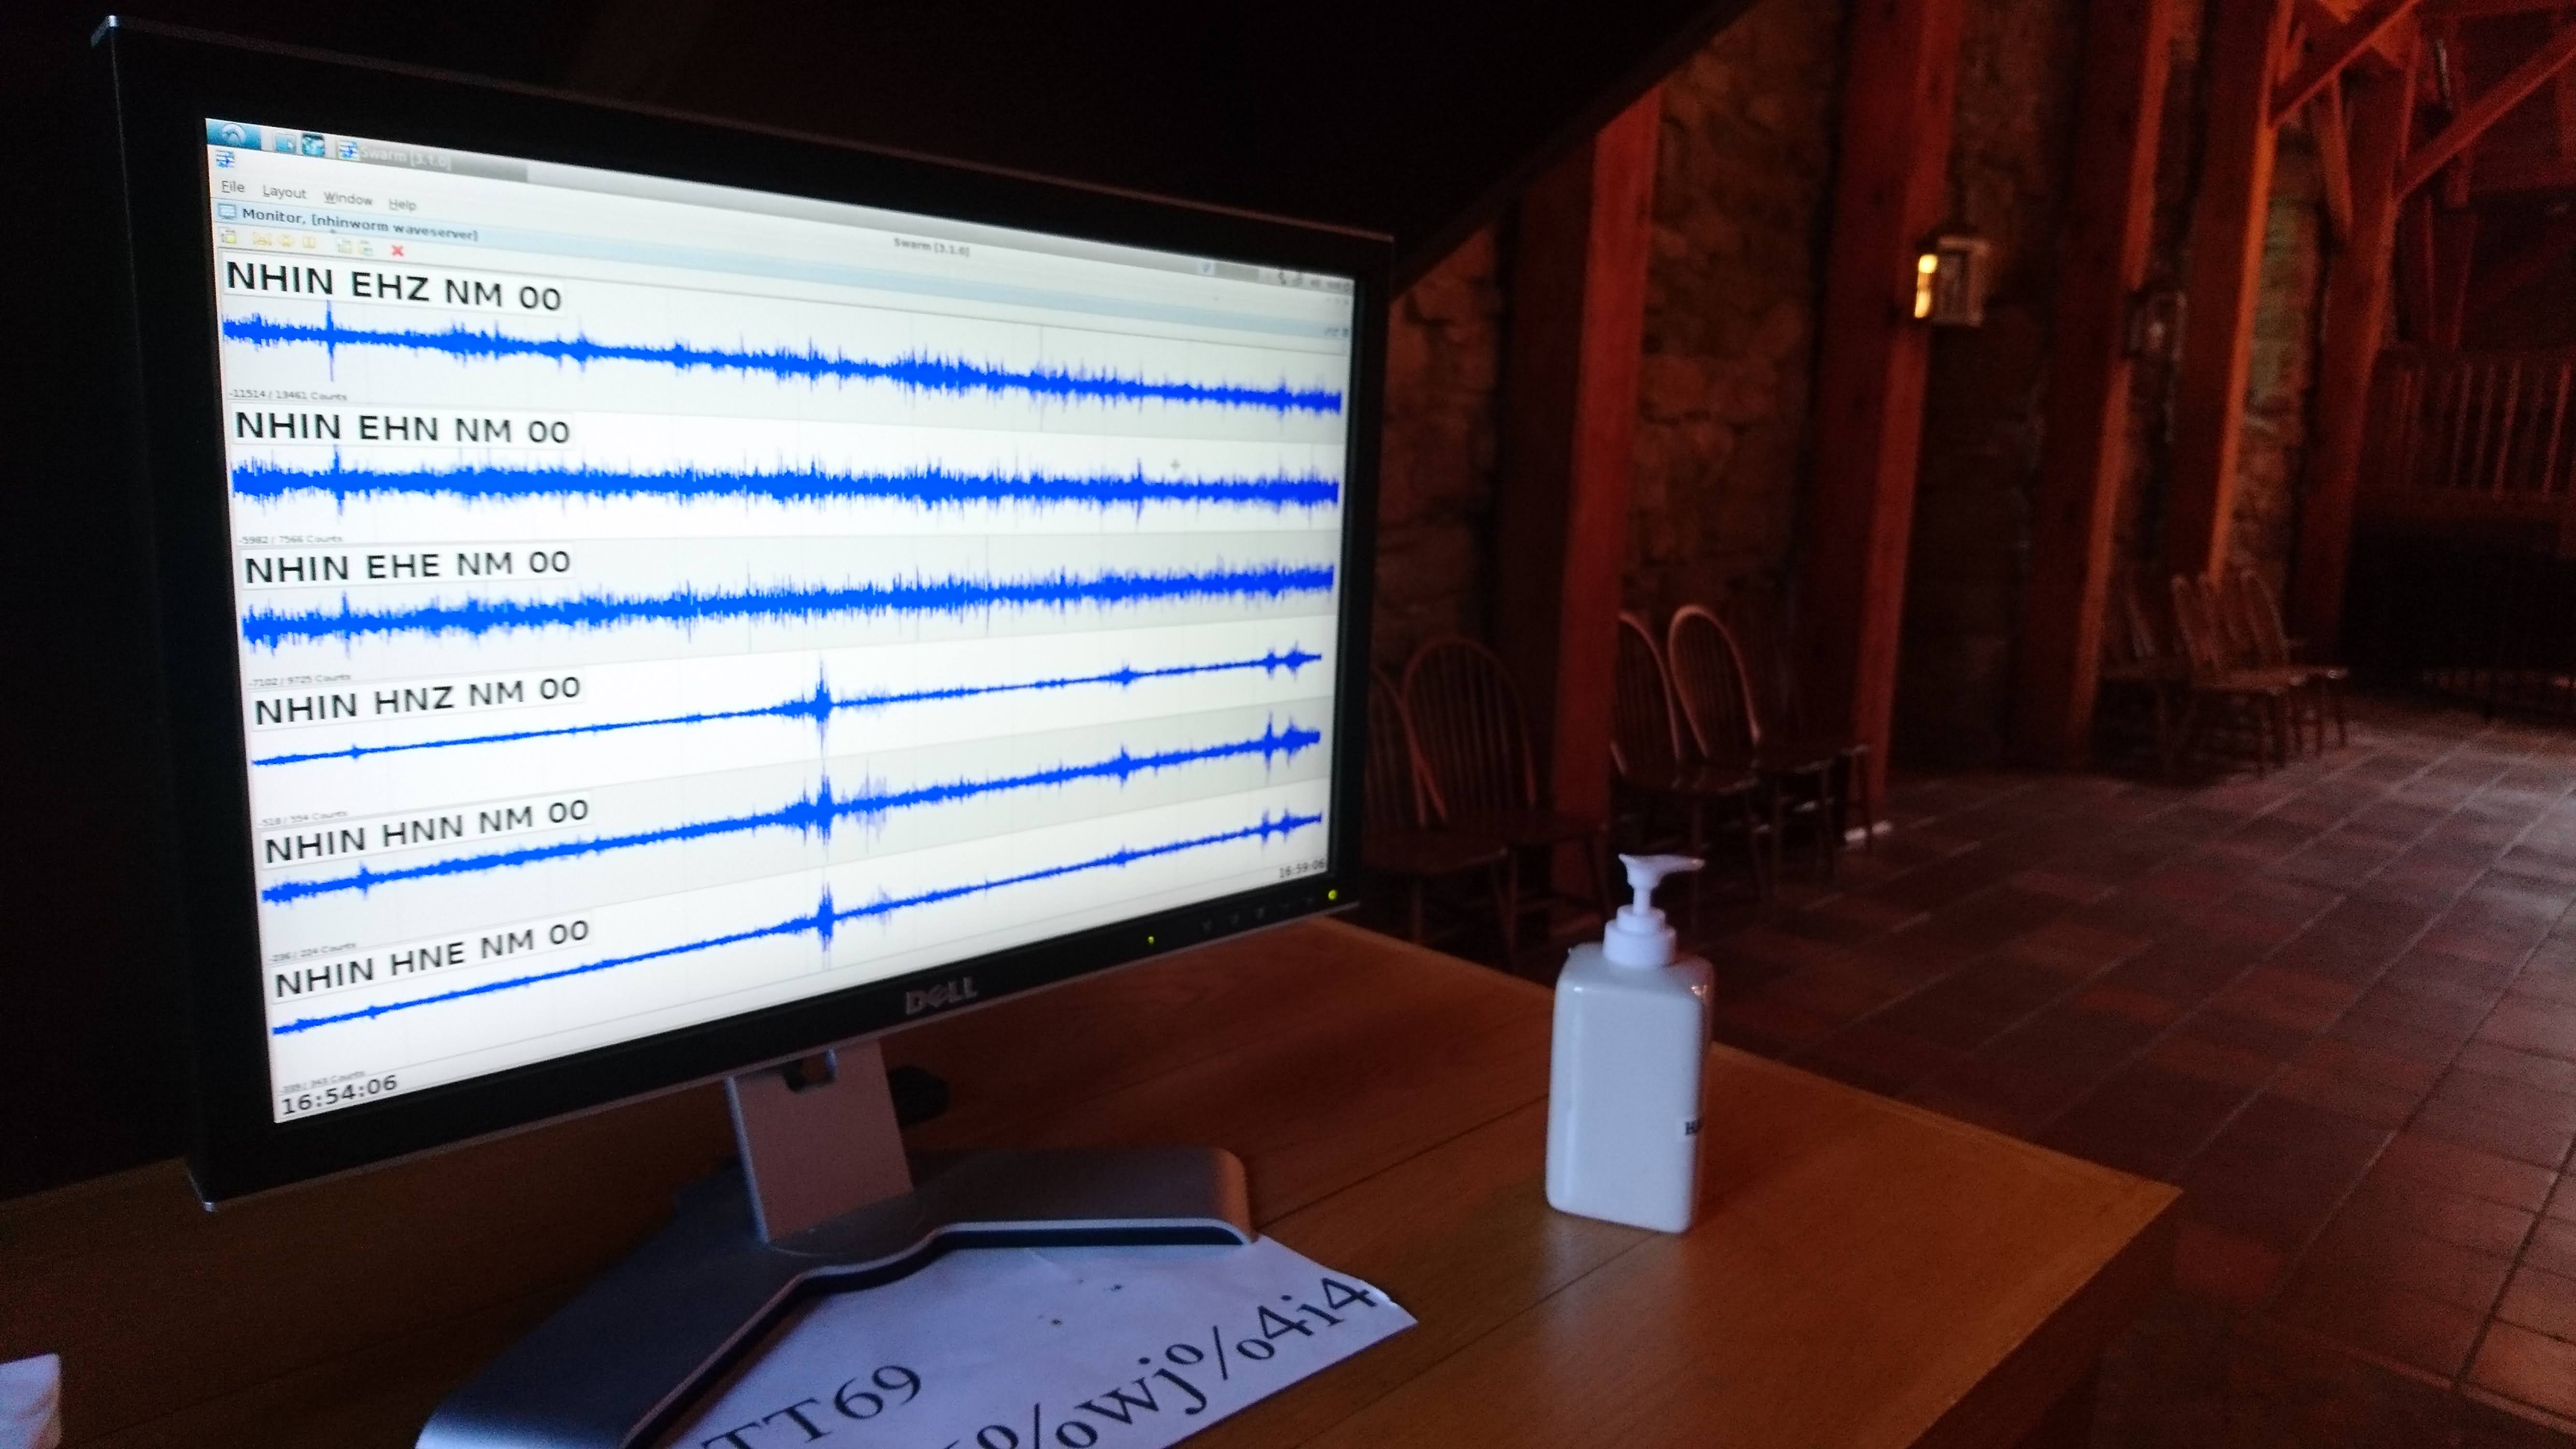
He used as his geologic laboratory the Granary building (pictured above) that had been built in 1818 and which had been used by William Maclure (often called the “Father of American Geology”) during Robert Owen’s tenure in New Harmony. The granary is one of the most enduring buildings in the nation devoted to geology, and nowadays, in addition to hosting weddings and other events, it still houses a seismometer that is part of a network that can be found at the website of the Incorporated Research Institutes for Seismology (IRIS) here (the local feed of that seismometer is shown in the picture above).
It is a fun tourist destination with loads of history. Having gotten to visit after our field work in the area, I highly recommend.
Getting Down to the Roots
We have been working on a project in partnership with Institute for Genomic Biology (IGB) at U of I called Realizing Increased Photosynthetic Efficiency (RIPE). The purpose of RIPE is to help breed plants that will be more adaptable to the expected climate in the next century. One field-based application, for example, allows plants to grow at 600 parts per million (ppm) of Carbon Dioxide (CO2). The current (average) concentration of CO2 in the air is more than 410 ppm, up from about 310 ppm less than one hundred years ago.

Our role in this project has been to “nondestructively phenotype” the crops they are working on. In other words, try to see and describe what’s going on underground without uprooting anything. To do this, we have been using a technology called Ground Penetrating Radar (GPR). Our GPR system sends radar waves into the ground, and records the beams that reflect back off of subsurface objects. The GPR system we have been using with this project has both the transmitting and receiving antennae in the same piece of equipment (some GPR units have these antennae separated). This GPR unit uses radar at a frequency of about 1000 megahertz (1 gigahertz). In the soil that we have at our project site, the waves will only penetrate about 1 meter down (and back) before the signal becomes too weak to be useful.
While it does not have very much range, it does have a fairly fine resolution. This has allowed us to image and even quantify the amount of root material underground. Pictured to the left is my colleague Tim, collecting data with a guide frame along a row of potatoes. Much of our work on this project has also involved Cassava.
This was also one of the few projects where, even though it was outside, there were a number of people in relatively close proximity (less than 50 feet). We collected data here twice in the summer/fall.
This was in itself an interesting experience, since we have been working on this project since 2017. It was familiar, but we had to get used to an entirely new research design around physical distancing, sanitation, and other mitigation measures.
The science of geology, hydrogeology, and geophysics continues in 2021, but this past year-the notorious 2020-has forever changed how we think about and do the science.

You must be logged in to post a comment.